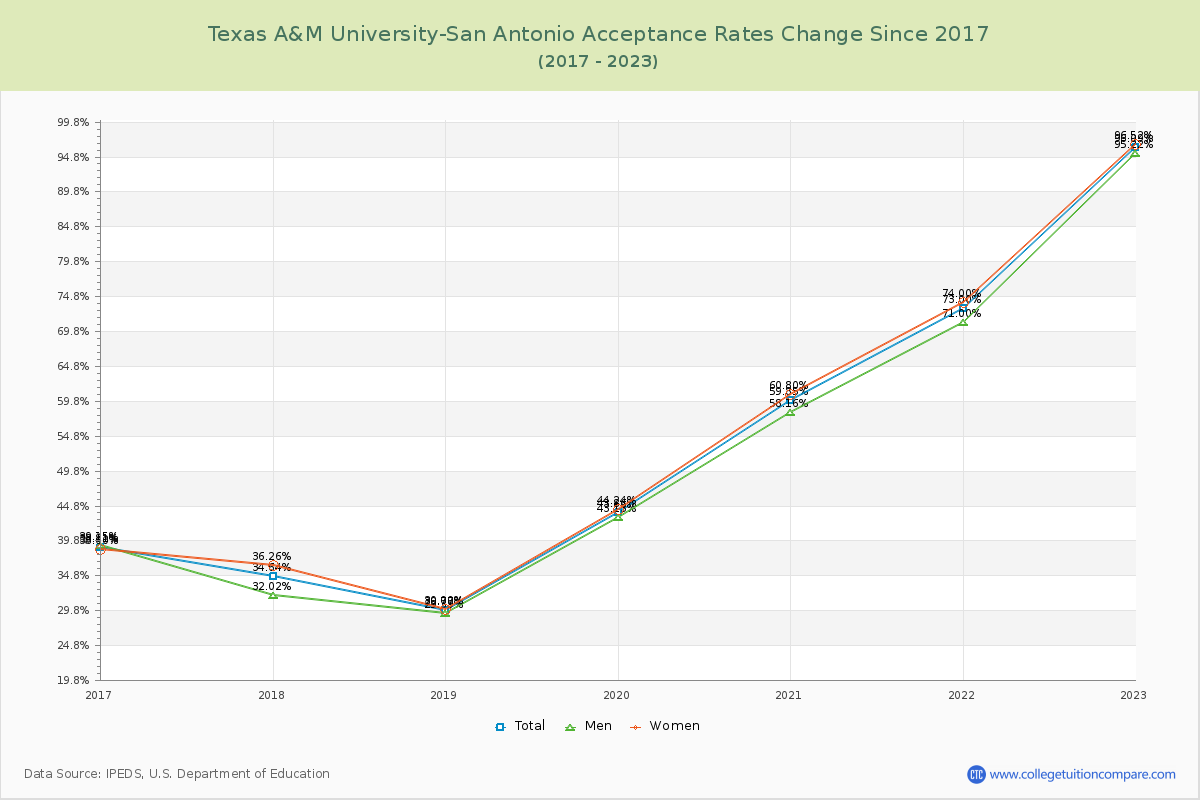
Acceptance Rate Changes
The average acceptance rate over the last 10 years is 53.72%, and this year's acceptance rate is 96.09% at Texas A&M University-San Antonio. By gender, men students' acceptance rate is 52.58% and women students' rate is 54.34%. For 2023 admission, it was easier to get into Texas A&M University-San Antonio than the previous year.
The next table and chart illustrate the acceptance rates changes at Texas A&M University-San Antonio over the past 7 years (2016-2023).
| Year | Total | Men | Women |
|---|---|---|---|
| 2016-17 | 38.81% | 39.15% | 38.60% |
| 2017-18 | 34.64% -4.17% |
32.02% -2.34% |
36.26% -2.34% |
| 2018-19 | 29.77% -4.87% |
29.39% -6.27% |
30.00% -6.27% |
| 2019-20 | 43.86% 14.09% |
43.13% 14.25% |
44.24% 14.25% |
| 2020-21 | 59.85% 16.00% |
58.16% 16.55% |
60.80% 16.55% |
| 2021-22 | 73.00% 13.14% |
71.00% 13.20% |
74.00% 13.20% |
| 2022-23 | 96.09% 23.10% |
95.22% 22.52% |
96.52% 22.52% |
| Average | 53.72% | 52.58% | 54.34% |