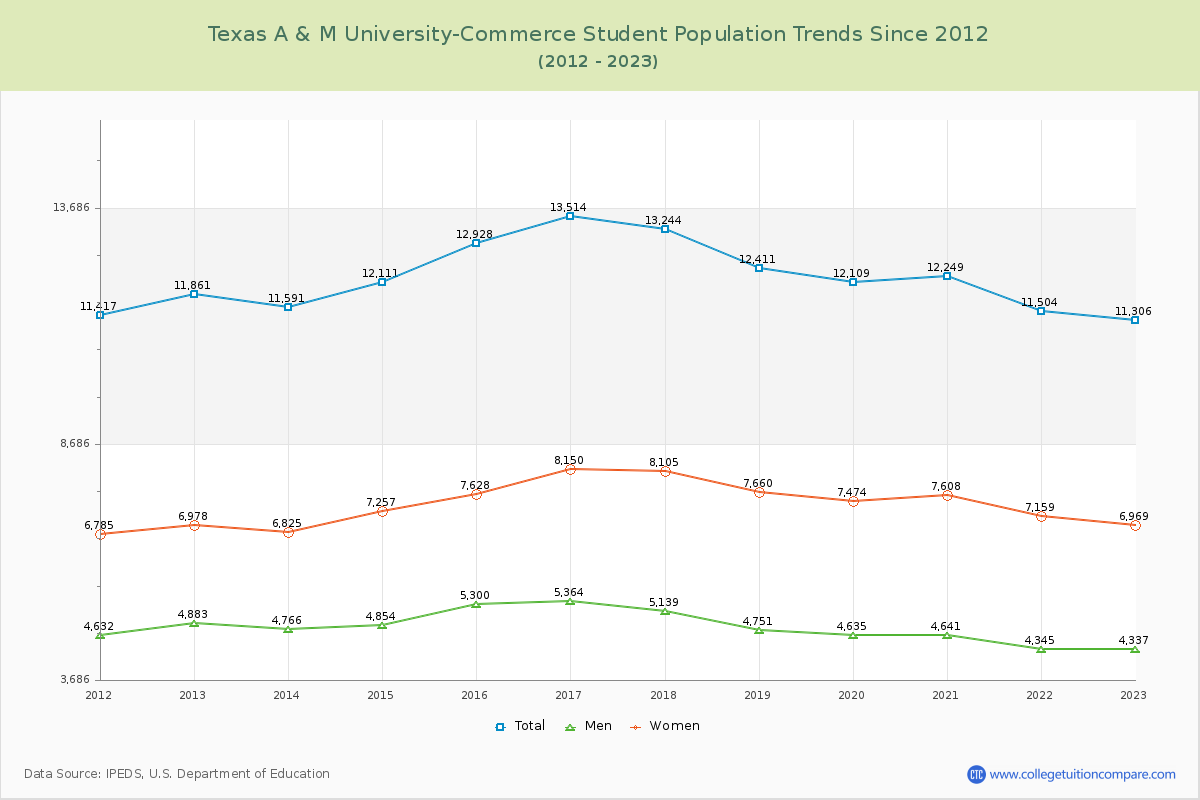
Student Population Changes
The average student population over the last 12 years is 12,257 where 11,306 students are attending the school for the academic year 2022-2023.
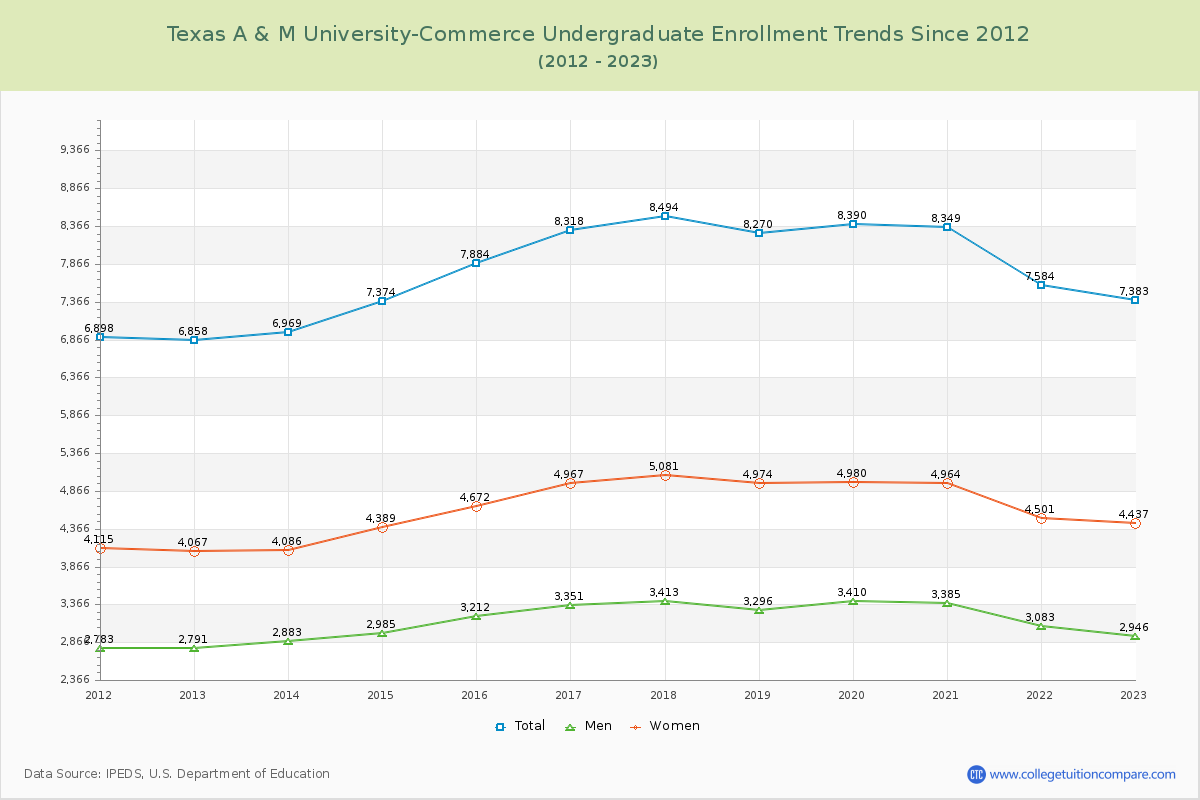
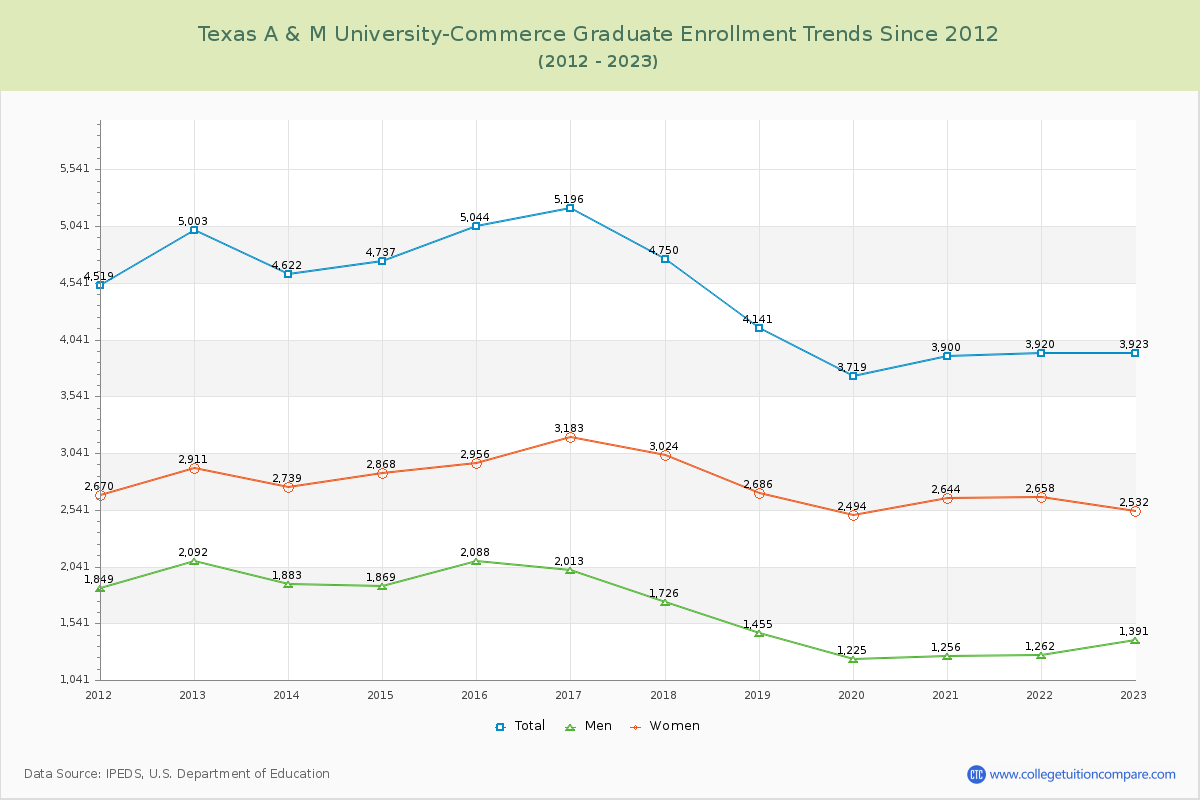
65.30% of total students is undergraduate students and 34.70% students is graduate students. The number of undergraduate students has increased by 525 and the graduate enrollment has decreased by 1,080 over past 10 years.
The female to male ratio is 1.61 to 1 and it means that there are more female students enrolled in TAMU Commerce than male students.
The following table and chart illustrate the changes in student population by gender at Texas A & M University-Commerce since 2012.
| Year | Total | Undergraduate | Graduate | ||||
|---|---|---|---|---|---|---|---|
| Total | Men | Women | Total | Men | Women | ||
| 2012-13 | 11,861 | 6,858 | 2,791 | 4,067 | 5,003 | 2,092 | 2,911 |
| 2013-14 | 11,591 -270 | 6,969 111 | 2,883 92 | 4,086 19 | 4,622 -381 | 1,883 -209 | 2,739 -172 |
| 2014-15 | 12,111 520 | 7,374 405 | 2,985 102 | 4,389 303 | 4,737 115 | 1,869 -14 | 2,868 129 |
| 2015-16 | 12,928 817 | 7,884 510 | 3,212 227 | 4,672 283 | 5,044 307 | 2,088 219 | 2,956 88 |
| 2016-17 | 13,514 586 | 8,318 434 | 3,351 139 | 4,967 295 | 5,196 152 | 2,013 -75 | 3,183 227 |
| 2017-18 | 13,244 -270 | 8,494 176 | 3,413 62 | 5,081 114 | 4,750 -446 | 1,726 -287 | 3,024 -159 |
| 2018-19 | 12,411 -833 | 8,270 -224 | 3,296 -117 | 4,974 -107 | 4,141 -609 | 1,455 -271 | 2,686 -338 |
| 2019-20 | 12,109 -302 | 8,390 120 | 3,410 114 | 4,980 6 | 3,719 -422 | 1,225 -230 | 2,494 -192 |
| 2020-21 | 12,249 140 | 8,349 -41 | 3,385 -25 | 4,964 -16 | 3,900 181 | 1,256 31 | 2,644 150 |
| 2021-22 | 11,504 -745 | 7,584 -765 | 3,083 -302 | 4,501 -463 | 3,920 20 | 1,262 6 | 2,658 14 |
| 2022-23 | 11,306 -198 | 7,383 -201 | 2,946 -137 | 4,437 -64 | 3,923 3 | 1,391 129 | 2,532 -126 |
| Average | 12,257 | 7,807 | 3,160 | 4,647 | 4,450 | 1,660 | 2,790 |