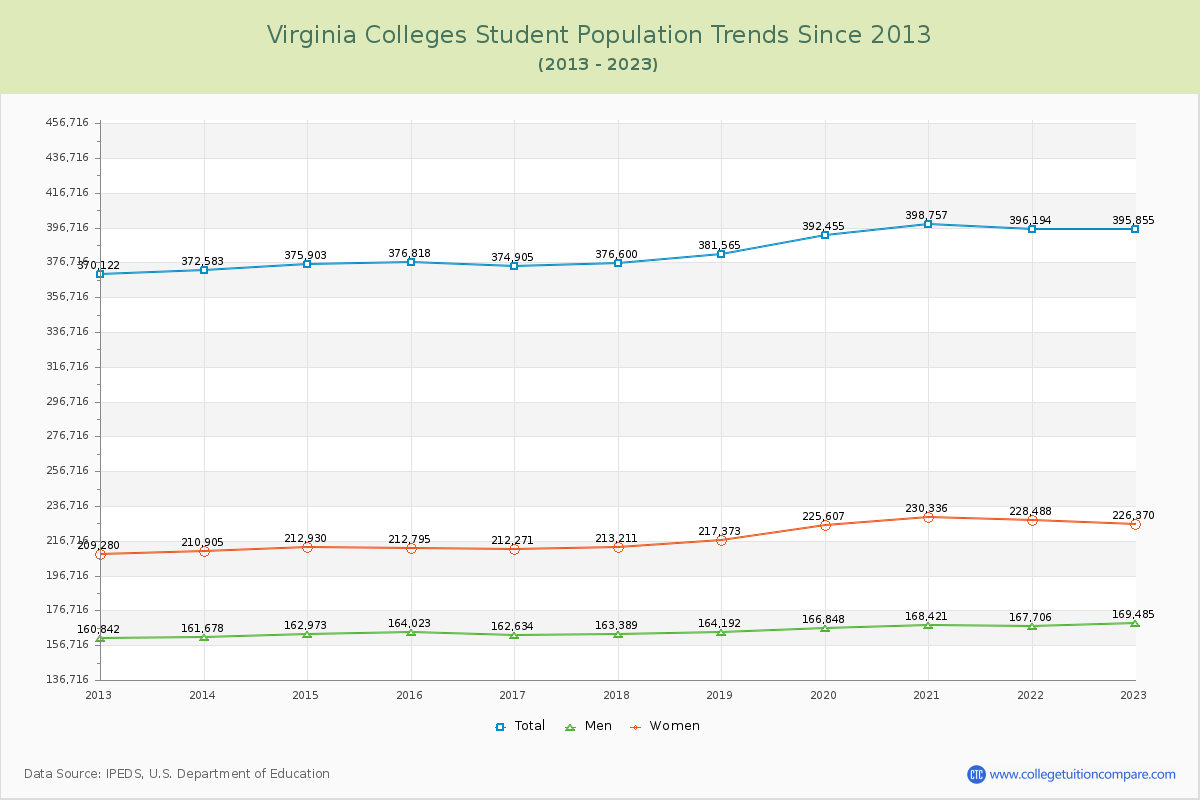
Student Population Changes
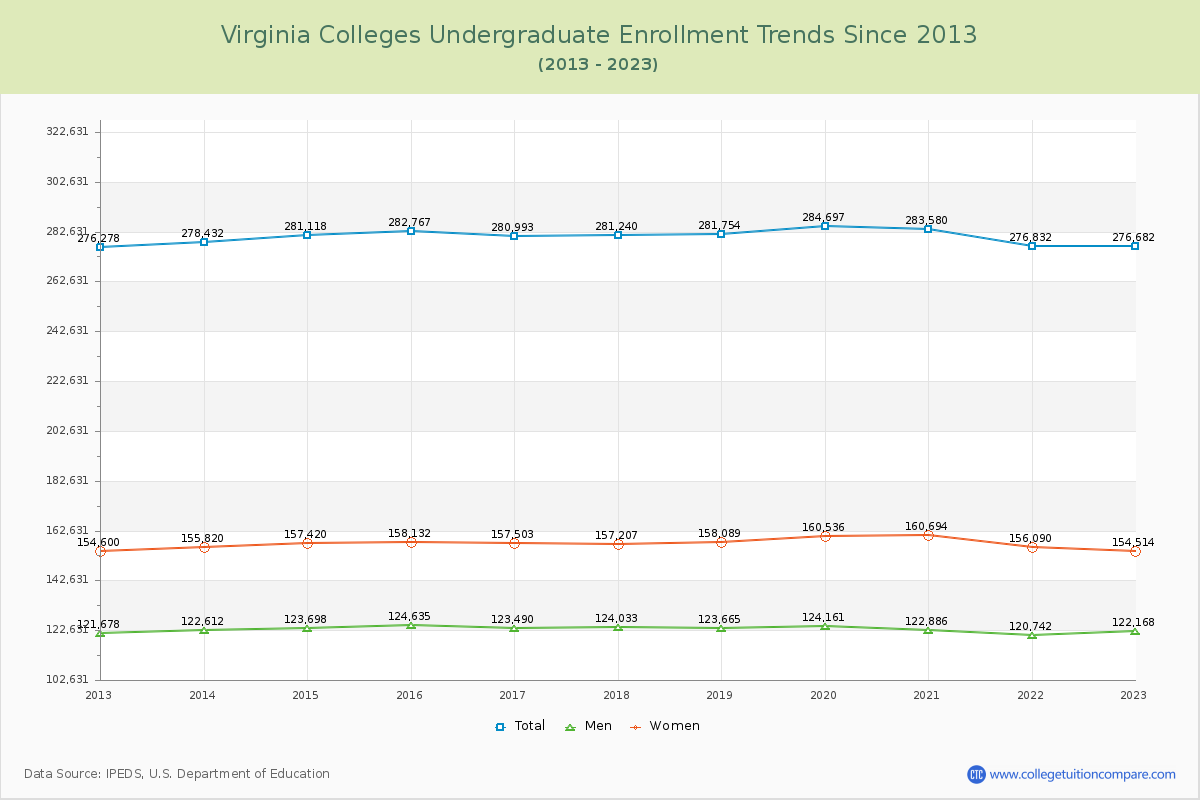
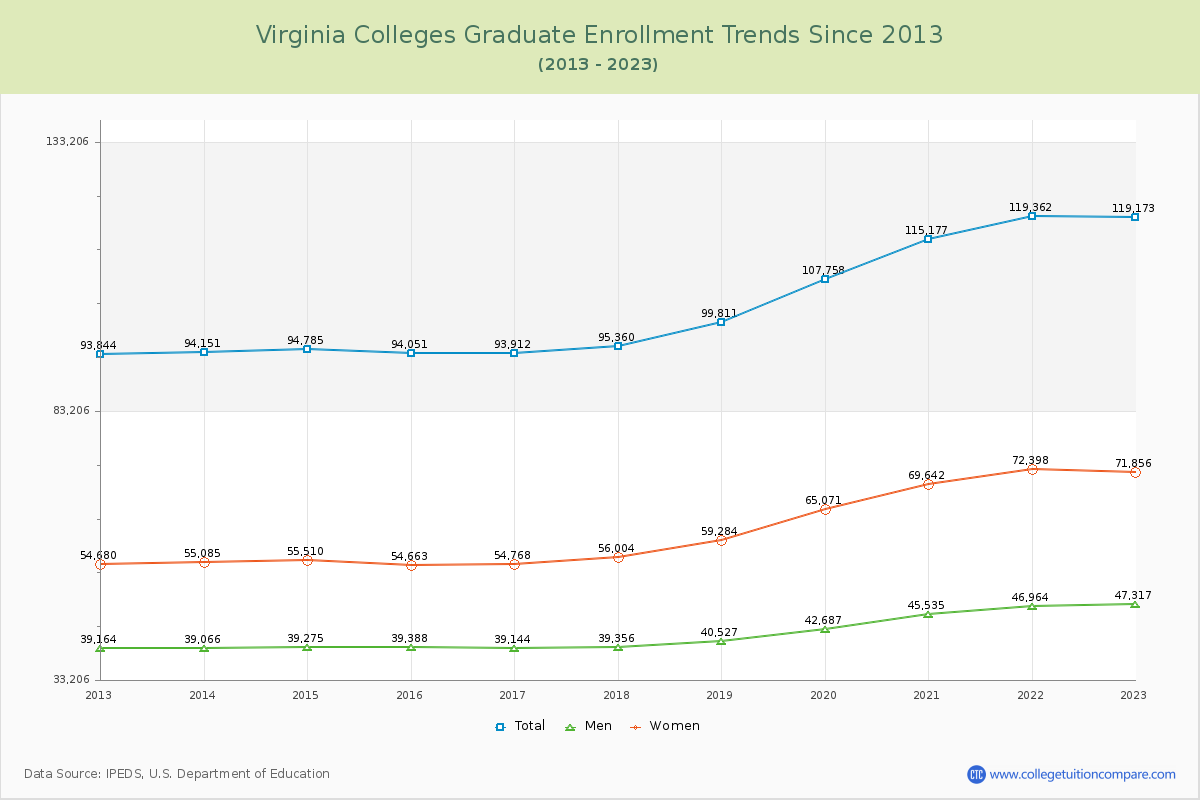
The average number of students over the past 11 years is 382,887, and 395,855 students were attending the schools in the academic year 2022-2023. Of the total students, 69.89% are undergraduate students and 30.11% are graduate students. Over the past 11, the number of undergraduate students increased by 404, and the graduate student enrollment increased by 25,329.
The female to male ratio is 1.34 to 1, meaning that there are more female students enrolled in Virginia Colleges than male students.
The following table and chart illustrate the changes in student population by gender at Virginia Colleges since 2013.
| Year | Total | Undergraduate | Graduate | ||||
|---|---|---|---|---|---|---|---|
| Total | Men | Women | Total | Men | Women | ||
| 2012-13 | 370,122 | 276,278 | 121,678 | 154,600 | 93,844 | 39,164 | 54,680 |
| 2013-14 | 372,583 2,461 | 278,432 2,154 | 122,612 934 | 155,820 1,220 | 94,151 307 | 39,066 -98 | 55,085 405 |
| 2014-15 | 375,903 3,320 | 281,118 2,686 | 123,698 1,086 | 157,420 1,600 | 94,785 634 | 39,275 209 | 55,510 425 |
| 2015-16 | 376,818 915 | 282,767 1,649 | 124,635 937 | 158,132 712 | 94,051 -734 | 39,388 113 | 54,663 -847 |
| 2016-17 | 374,905 -1,913 | 280,993 -1,774 | 123,490 -1,145 | 157,503 -629 | 93,912 -139 | 39,144 -244 | 54,768 105 |
| 2017-18 | 376,600 1,695 | 281,240 247 | 124,033 543 | 157,207 -296 | 95,360 1,448 | 39,356 212 | 56,004 1,236 |
| 2018-19 | 381,565 4,965 | 281,754 514 | 123,665 -368 | 158,089 882 | 99,811 4,451 | 40,527 1,171 | 59,284 3,280 |
| 2019-20 | 392,455 10,890 | 284,697 2,943 | 124,161 496 | 160,536 2,447 | 107,758 7,947 | 42,687 2,160 | 65,071 5,787 |
| 2020-21 | 398,757 6,302 | 283,580 -1,117 | 122,886 -1,275 | 160,694 158 | 115,177 7,419 | 45,535 2,848 | 69,642 4,571 |
| 2021-22 | 396,194 -2,563 | 276,832 -6,748 | 120,742 -2,144 | 156,090 -4,604 | 119,362 4,185 | 46,964 1,429 | 72,398 2,756 |
| 2022-23 | 395,855 -339 | 276,682 -150 | 122,168 1,426 | 154,514 -1,576 | 119,173 -189 | 47,317 353 | 71,856 -542 |
| Average | 382,887 | 280,398 | 123,070 | 157,328 | 102,489 | 41,675 | 60,815 |