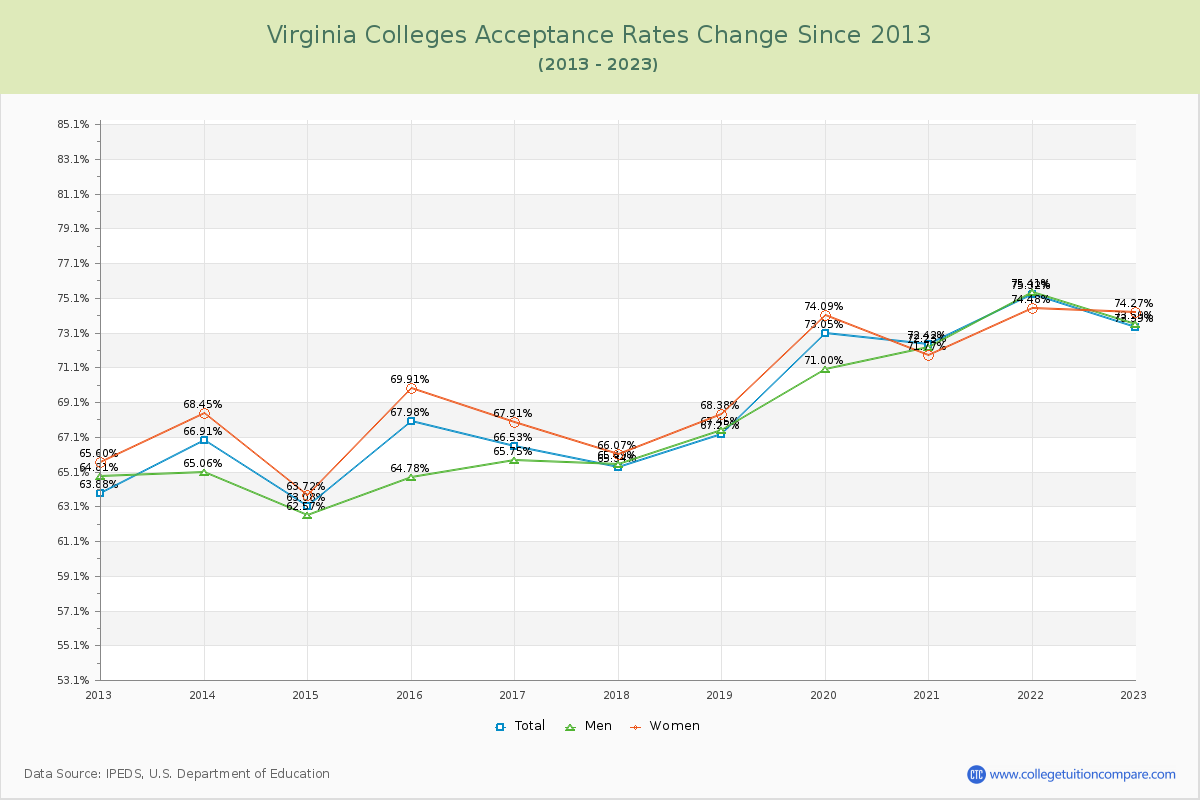
Acceptance Rate Changes
The average acceptance rate over the last 10 years is 68.65% where the current academic year rate is 73.39% at Virginia Colleges. By gender, men students' acceptance rate is 68.01% and women students' rate is 69.51%. The next table and chart illustrate the acceptance rates changes at Virginia Colleges over the past 11 years (2012-2023).
| Year | Total | Men | Women |
|---|---|---|---|
| 2012-13 | 63.88% | 64.81% | 65.60% |
| 2013-14 | 66.91% 3.04% |
65.06% 2.85% |
68.45% 2.85% |
| 2014-15 | 63.08% -3.83% |
62.57% -4.73% |
63.72% -4.73% |
| 2015-16 | 67.98% 4.89% |
64.78% 6.19% |
69.91% 6.19% |
| 2016-17 | 66.53% -1.45% |
65.75% -2.00% |
67.91% -2.00% |
| 2017-18 | 65.34% -1.19% |
65.49% -1.85% |
66.07% -1.85% |
| 2018-19 | 67.25% 1.91% |
67.45% 2.31% |
68.38% 2.31% |
| 2019-20 | 73.05% 5.80% |
71.00% 5.71% |
74.09% 5.71% |
| 2020-21 | 72.42% -0.64% |
72.23% -2.32% |
71.77% -2.32% |
| 2021-22 | 75.32% 2.90% |
75.41% 2.71% |
74.48% 2.71% |
| 2022-23 | 73.39% -1.93% |
73.59% -0.20% |
74.27% -0.20% |
| Average | 68.65% | 68.01% | 69.51% |