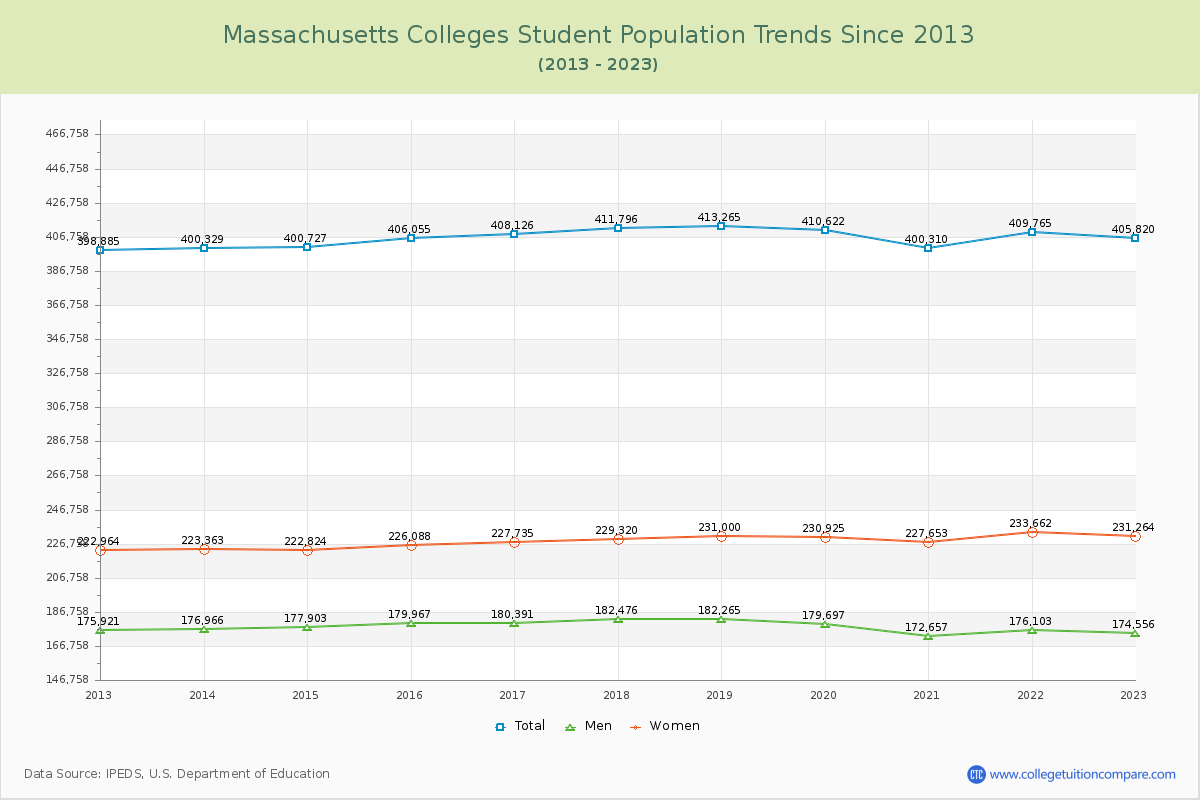
Student Population Changes
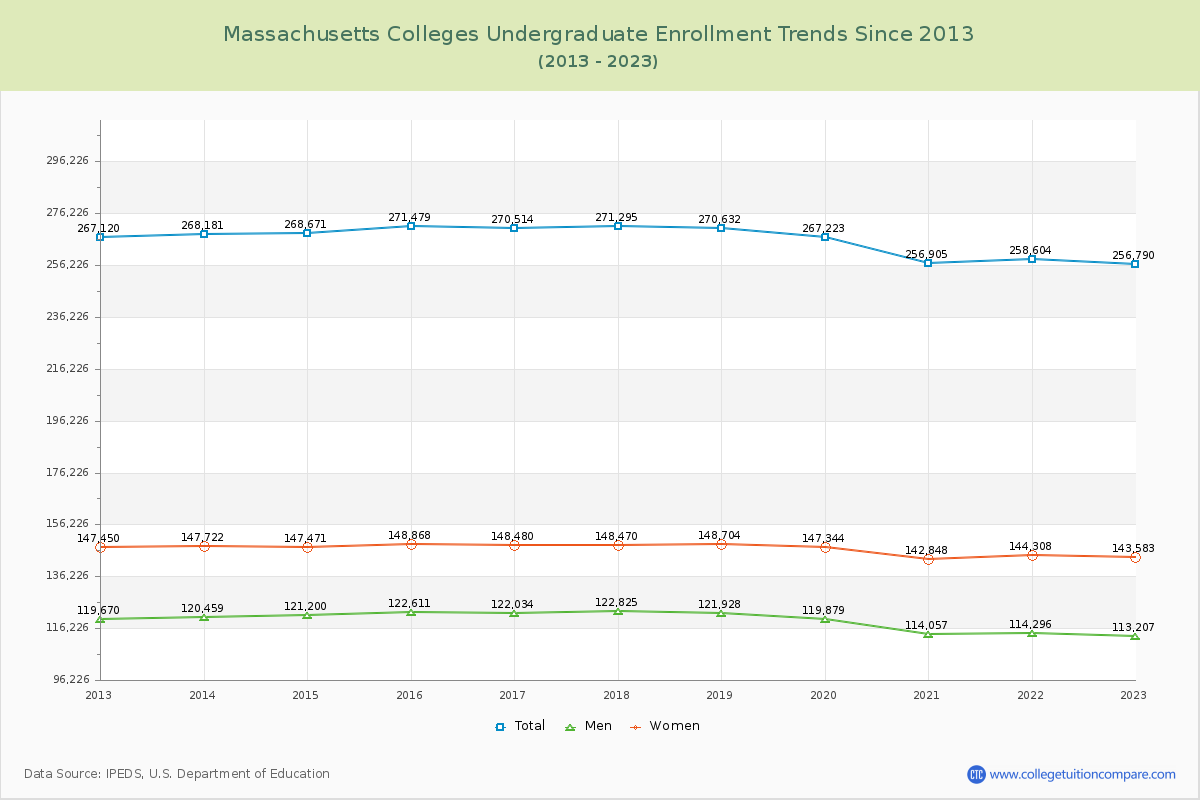
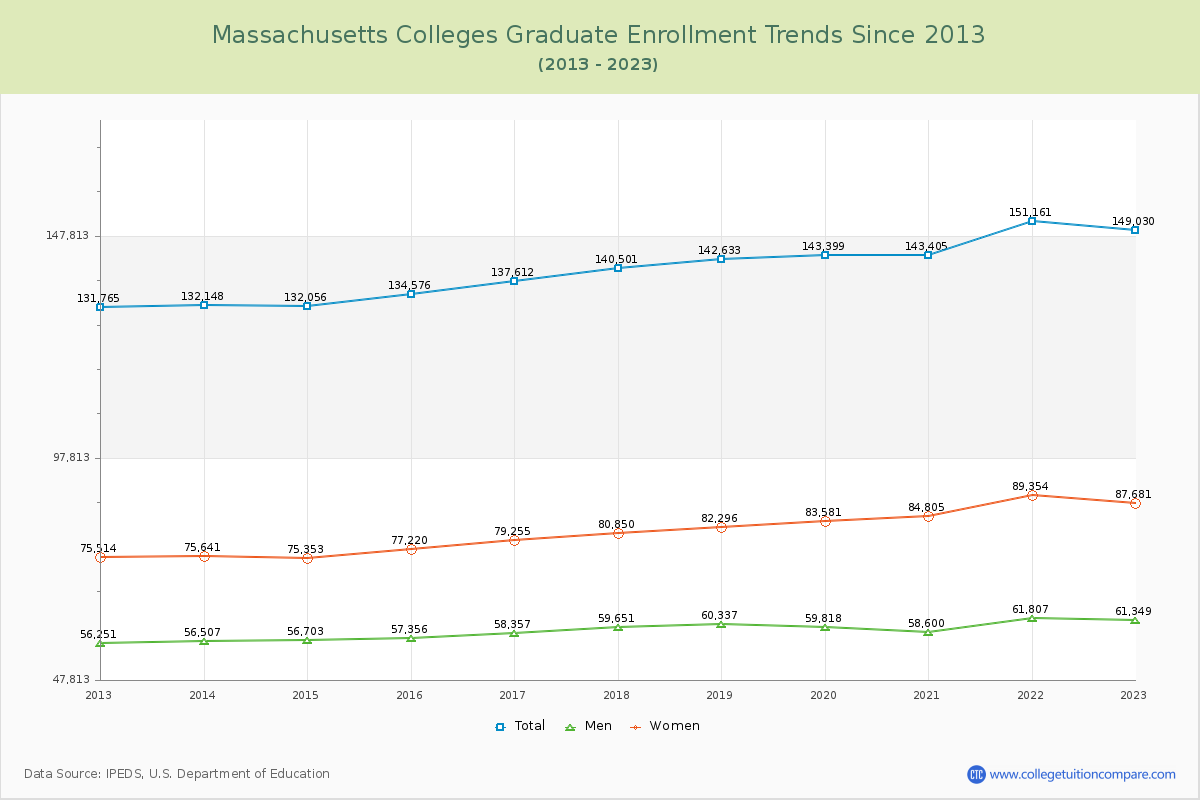
The average number of students over the past 11 years is 405,973, and 405,820 students were attending the schools in the academic year 2022-2023. Of the total students, 63.28% are undergraduate students and 36.72% are graduate students. Over the past 11, the number of undergraduate students decreased by 10,330, and the graduate student enrollment increased by 17,265.
The female to male ratio is 1.32 to 1, meaning that there are more female students enrolled in Massachusetts Colleges than male students.
The following table and chart illustrate the changes in student population by gender at Massachusetts Colleges since 2013.
| Year | Total | Undergraduate | Graduate | ||||
|---|---|---|---|---|---|---|---|
| Total | Men | Women | Total | Men | Women | ||
| 2012-13 | 398,885 | 267,120 | 119,670 | 147,450 | 131,765 | 56,251 | 75,514 |
| 2013-14 | 400,329 1,444 | 268,181 1,061 | 120,459 789 | 147,722 272 | 132,148 383 | 56,507 256 | 75,641 127 |
| 2014-15 | 400,727 398 | 268,671 490 | 121,200 741 | 147,471 -251 | 132,056 -92 | 56,703 196 | 75,353 -288 |
| 2015-16 | 406,055 5,328 | 271,479 2,808 | 122,611 1,411 | 148,868 1,397 | 134,576 2,520 | 57,356 653 | 77,220 1,867 |
| 2016-17 | 408,126 2,071 | 270,514 -965 | 122,034 -577 | 148,480 -388 | 137,612 3,036 | 58,357 1,001 | 79,255 2,035 |
| 2017-18 | 411,796 3,670 | 271,295 781 | 122,825 791 | 148,470 -10 | 140,501 2,889 | 59,651 1,294 | 80,850 1,595 |
| 2018-19 | 413,265 1,469 | 270,632 -663 | 121,928 -897 | 148,704 234 | 142,633 2,132 | 60,337 686 | 82,296 1,446 |
| 2019-20 | 410,622 -2,643 | 267,223 -3,409 | 119,879 -2,049 | 147,344 -1,360 | 143,399 766 | 59,818 -519 | 83,581 1,285 |
| 2020-21 | 400,310 -10,312 | 256,905 -10,318 | 114,057 -5,822 | 142,848 -4,496 | 143,405 6 | 58,600 -1,218 | 84,805 1,224 |
| 2021-22 | 409,765 9,455 | 258,604 1,699 | 114,296 239 | 144,308 1,460 | 151,161 7,756 | 61,807 3,207 | 89,354 4,549 |
| 2022-23 | 405,820 -3,945 | 256,790 -1,814 | 113,207 -1,089 | 143,583 -725 | 149,030 -2,131 | 61,349 -458 | 87,681 -1,673 |
| Average | 405,973 | 266,129 | 119,288 | 146,841 | 139,844 | 58,794 | 81,050 |