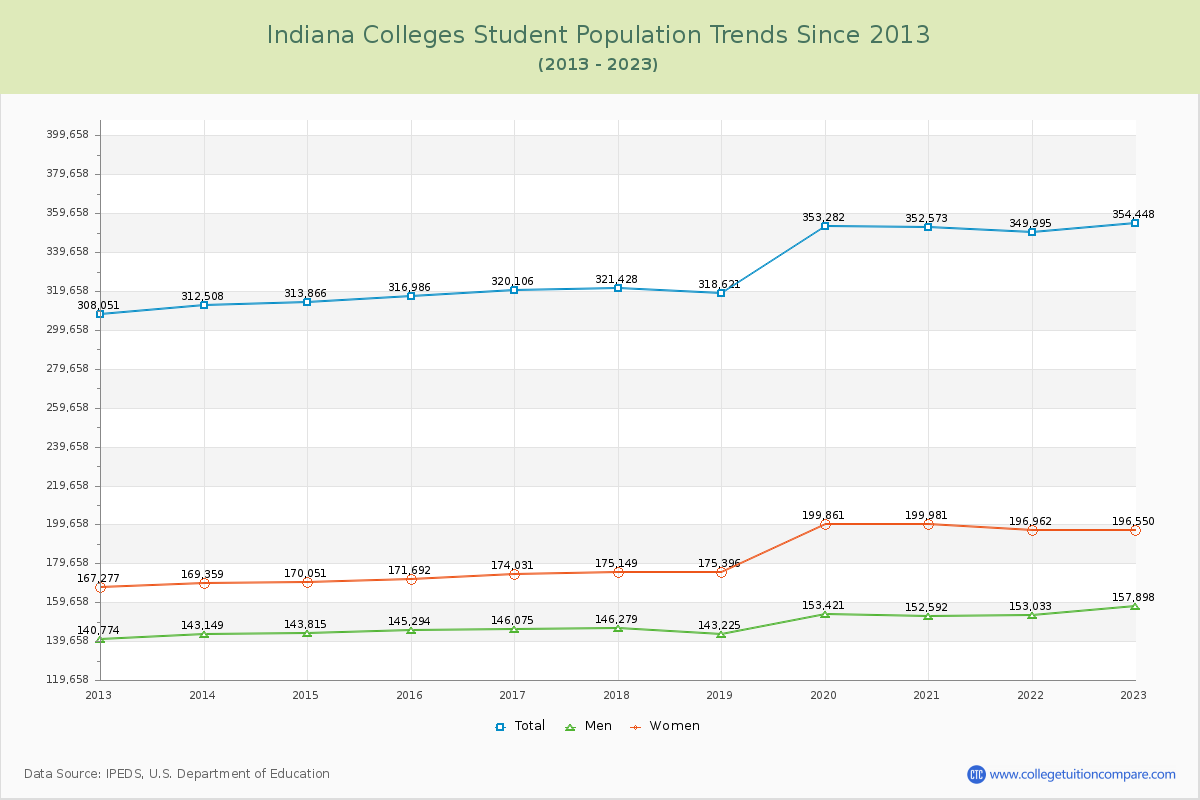
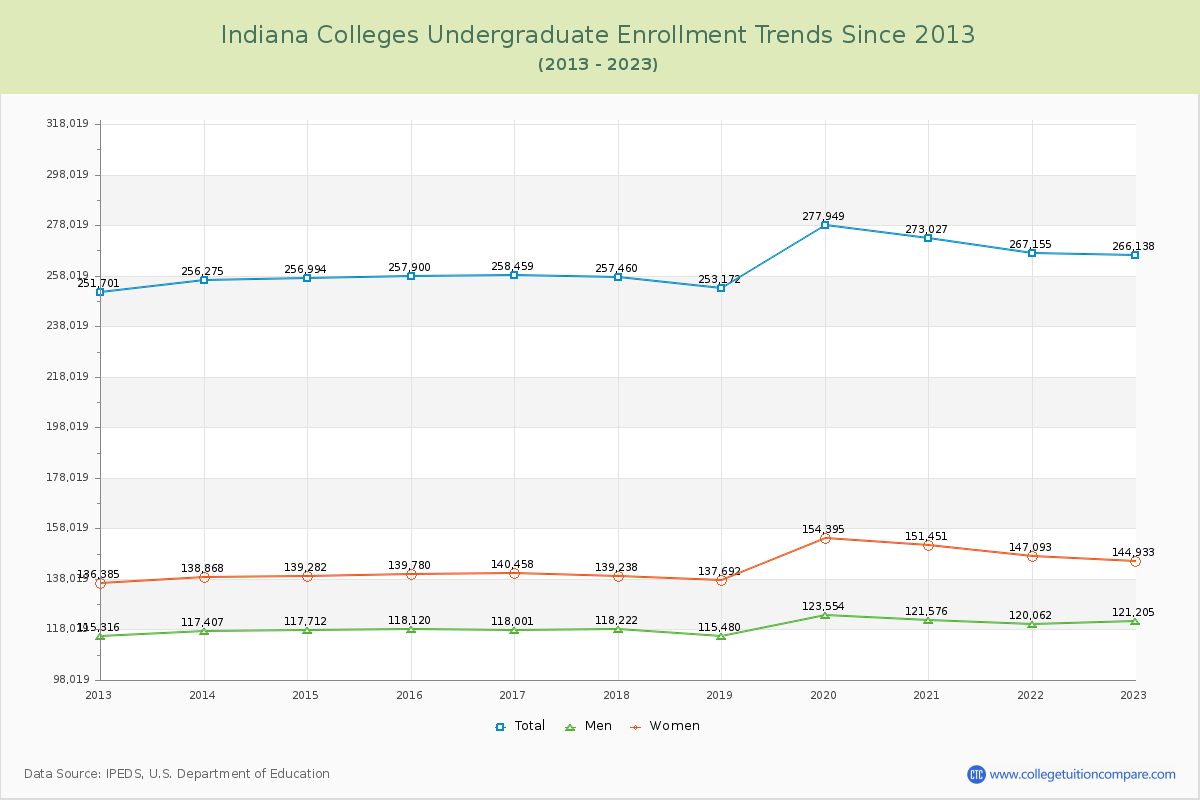
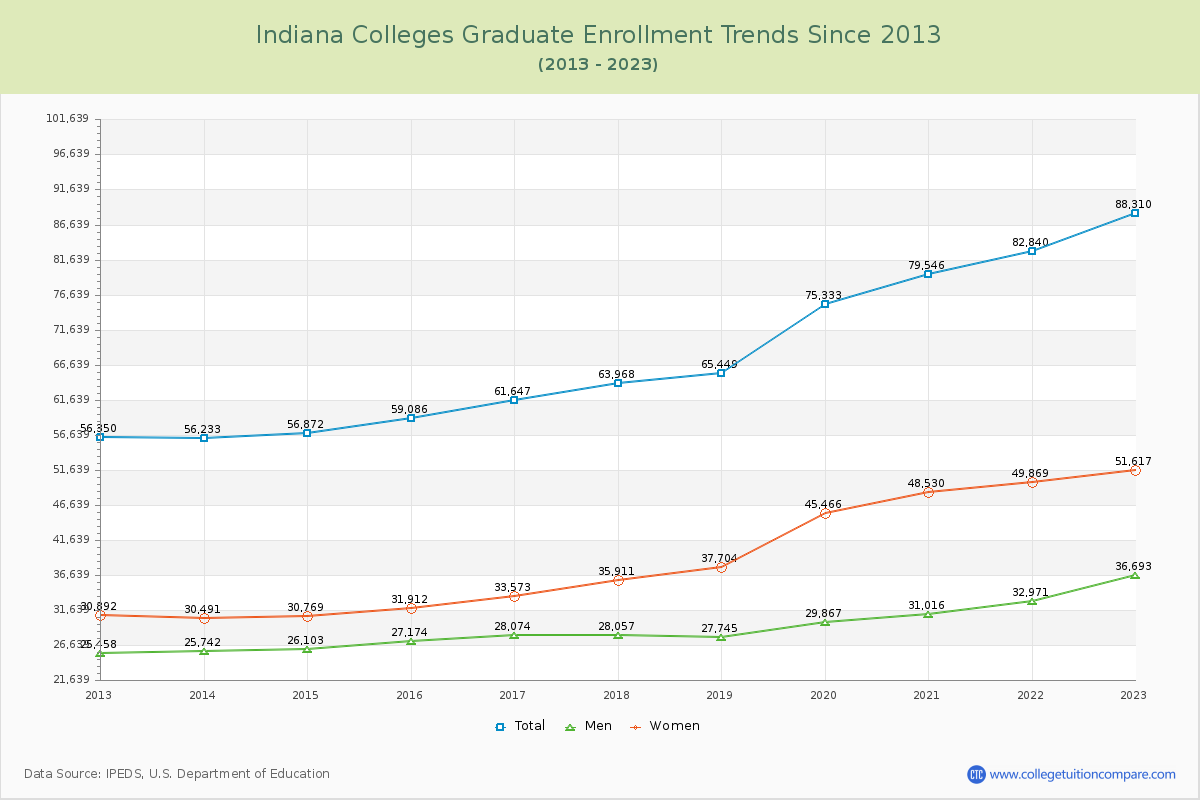
Student Population Changes
The average number of students over the past 11 years is 329,260, and 354,448 students were attending the schools in the academic year 2022-2023. Of the total students, 75.09% are undergraduate students and 24.91% are graduate students. Over the past 11, the number of undergraduate students increased by 14,437, and the graduate student enrollment increased by 31,960.
The female to male ratio is 1.24 to 1, meaning that there are slightly more female students enrolled in Indiana Colleges than male students.
The following table and chart illustrate the changes in student population by gender at Indiana Colleges since 2013.
| Year | Total | Undergraduate | Graduate | ||||
|---|---|---|---|---|---|---|---|
| Total | Men | Women | Total | Men | Women | ||
| 2012-13 | 308,051 | 251,701 | 115,316 | 136,385 | 56,350 | 25,458 | 30,892 |
| 2013-14 | 312,508 4,457 | 256,275 4,574 | 117,407 2,091 | 138,868 2,483 | 56,233 -117 | 25,742 284 | 30,491 -401 |
| 2014-15 | 313,866 1,358 | 256,994 719 | 117,712 305 | 139,282 414 | 56,872 639 | 26,103 361 | 30,769 278 |
| 2015-16 | 316,986 3,120 | 257,900 906 | 118,120 408 | 139,780 498 | 59,086 2,214 | 27,174 1,071 | 31,912 1,143 |
| 2016-17 | 320,106 3,120 | 258,459 559 | 118,001 -119 | 140,458 678 | 61,647 2,561 | 28,074 900 | 33,573 1,661 |
| 2017-18 | 321,428 1,322 | 257,460 -999 | 118,222 221 | 139,238 -1,220 | 63,968 2,321 | 28,057 -17 | 35,911 2,338 |
| 2018-19 | 318,621 -2,807 | 253,172 -4,288 | 115,480 -2,742 | 137,692 -1,546 | 65,449 1,481 | 27,745 -312 | 37,704 1,793 |
| 2019-20 | 353,282 34,661 | 277,949 24,777 | 123,554 8,074 | 154,395 16,703 | 75,333 9,884 | 29,867 2,122 | 45,466 7,762 |
| 2020-21 | 352,573 -709 | 273,027 -4,922 | 121,576 -1,978 | 151,451 -2,944 | 79,546 4,213 | 31,016 1,149 | 48,530 3,064 |
| 2021-22 | 349,995 -2,578 | 267,155 -5,872 | 120,062 -1,514 | 147,093 -4,358 | 82,840 3,294 | 32,971 1,955 | 49,869 1,339 |
| 2022-23 | 354,448 4,453 | 266,138 -1,017 | 121,205 1,143 | 144,933 -2,160 | 88,310 5,470 | 36,693 3,722 | 51,617 1,748 |
| Average | 329,260 | 261,475 | 118,787 | 142,689 | 67,785 | 28,991 | 38,794 |