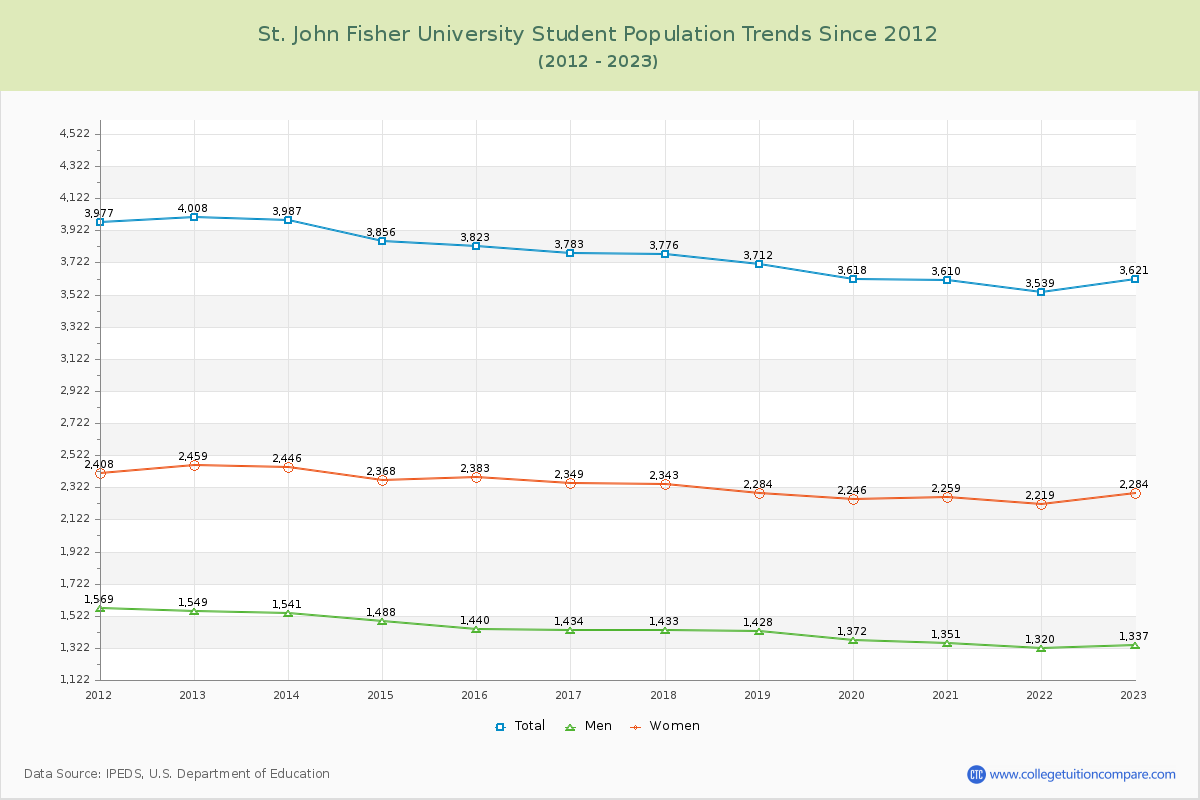
Student Population Changes
The average student population over the last 12 years is 3,758 where 3,621 students are attending the school for the academic year 2022-2023.
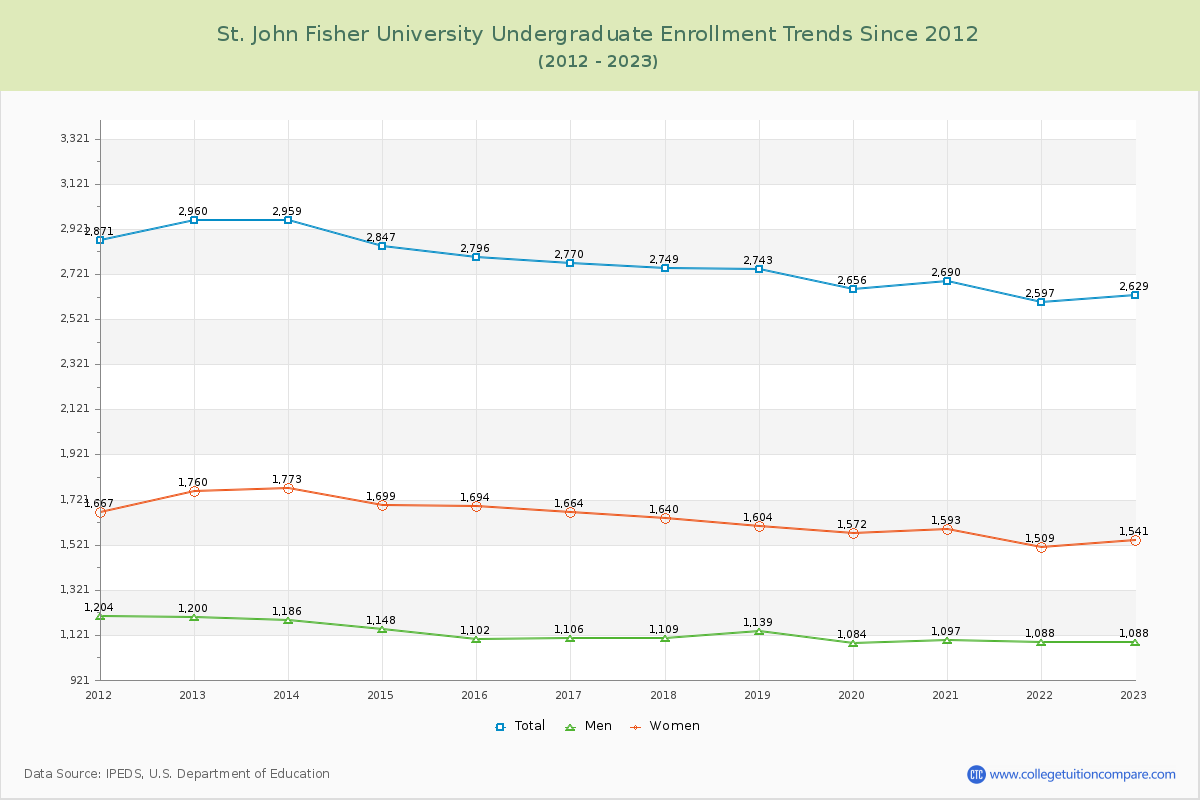
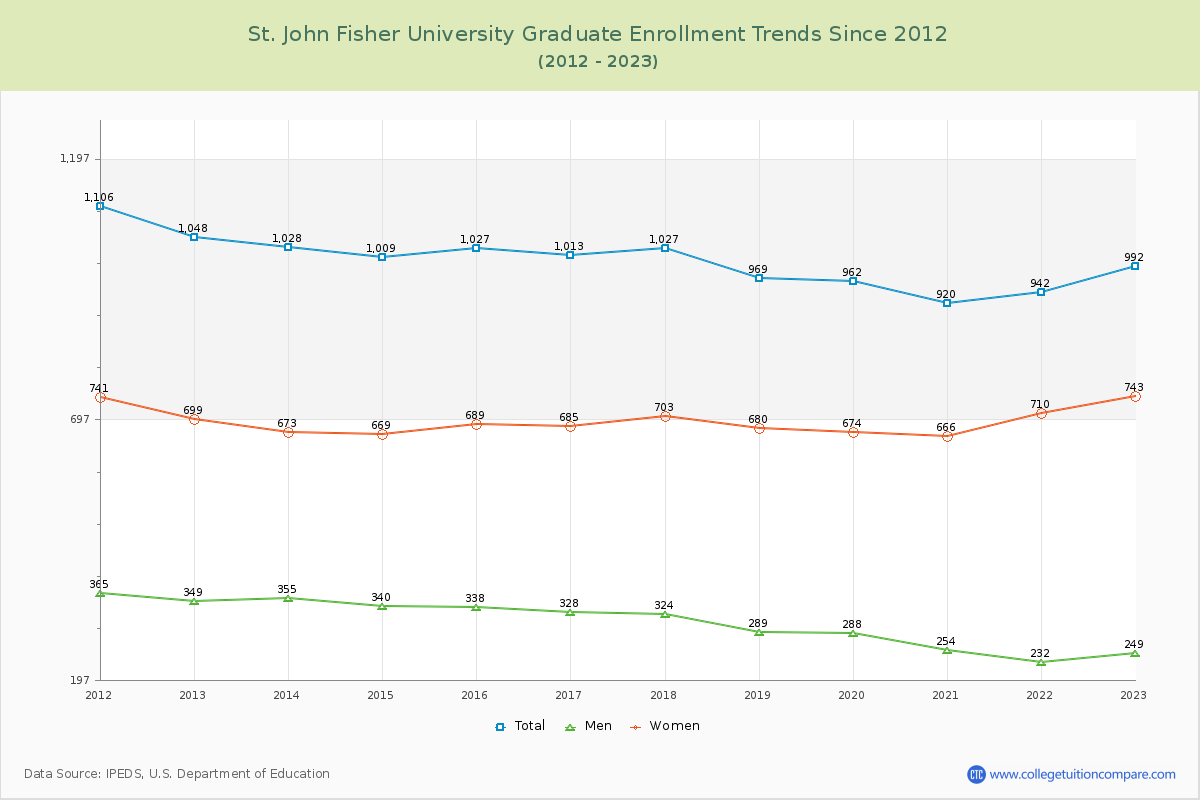
72.60% of total students is undergraduate students and 27.40% students is graduate students. The number of undergraduate students has decreased by 331 and the graduate enrollment has decreased by 56 over past 10 years.
The female to male ratio is 1.71 to 1 and it means that there are more female students enrolled in Fisher than male students.
The following table and chart illustrate the changes in student population by gender at St. John Fisher University since 2012.
| Year | Total | Undergraduate | Graduate | ||||
|---|---|---|---|---|---|---|---|
| Total | Men | Women | Total | Men | Women | ||
| 2012-13 | 4,008 | 2,960 | 1,200 | 1,760 | 1,048 | 349 | 699 |
| 2013-14 | 3,987 -21 | 2,959 -1 | 1,186 -14 | 1,773 13 | 1,028 -20 | 355 6 | 673 -26 |
| 2014-15 | 3,856 -131 | 2,847 -112 | 1,148 -38 | 1,699 -74 | 1,009 -19 | 340 -15 | 669 -4 |
| 2015-16 | 3,823 -33 | 2,796 -51 | 1,102 -46 | 1,694 -5 | 1,027 18 | 338 -2 | 689 20 |
| 2016-17 | 3,783 -40 | 2,770 -26 | 1,106 4 | 1,664 -30 | 1,013 -14 | 328 -10 | 685 -4 |
| 2017-18 | 3,776 -7 | 2,749 -21 | 1,109 3 | 1,640 -24 | 1,027 14 | 324 -4 | 703 18 |
| 2018-19 | 3,712 -64 | 2,743 -6 | 1,139 30 | 1,604 -36 | 969 -58 | 289 -35 | 680 -23 |
| 2019-20 | 3,618 -94 | 2,656 -87 | 1,084 -55 | 1,572 -32 | 962 -7 | 288 -1 | 674 -6 |
| 2020-21 | 3,610 -8 | 2,690 34 | 1,097 13 | 1,593 21 | 920 -42 | 254 -34 | 666 -8 |
| 2021-22 | 3,539 -71 | 2,597 -93 | 1,088 -9 | 1,509 -84 | 942 22 | 232 -22 | 710 44 |
| 2022-23 | 3,621 82 | 2,629 32 | 1,088 0 | 1,541 32 | 992 50 | 249 17 | 743 33 |
| Average | 3,758 | 2,763 | 1,122 | 1,641 | 994 | 304 | 690 |