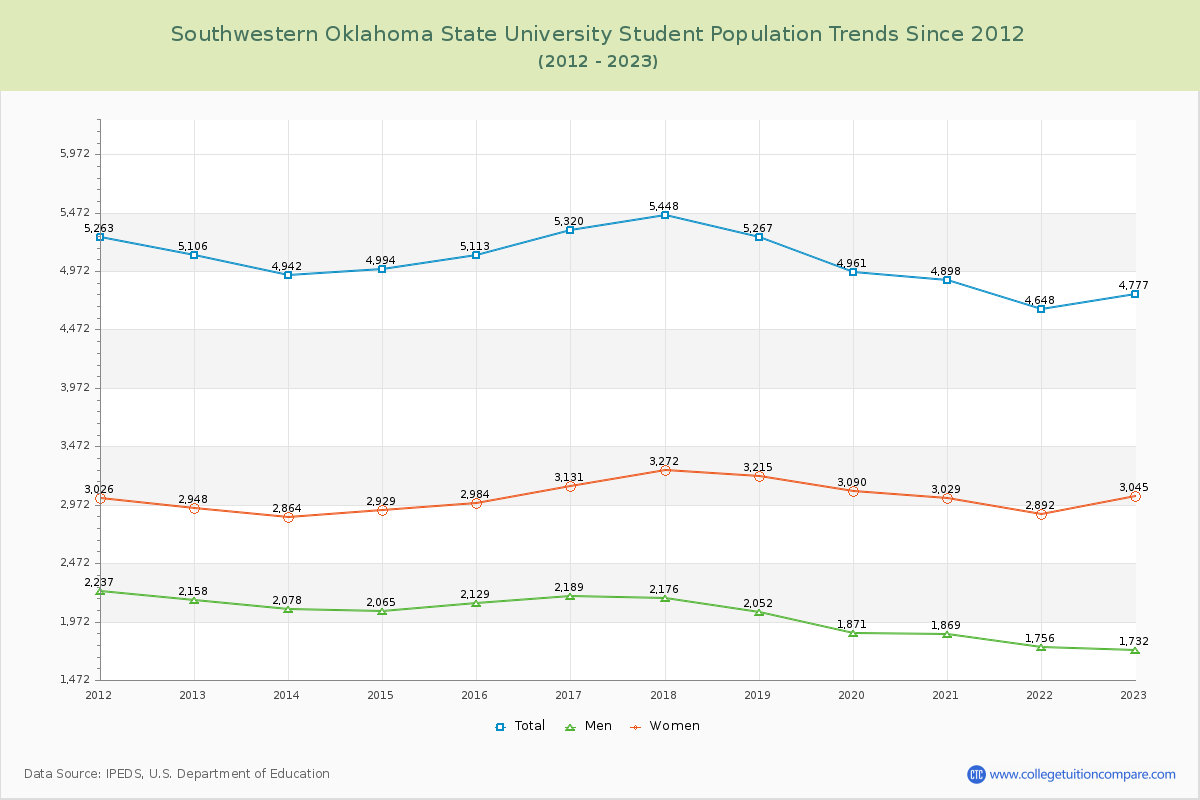
Student Population Changes
The average student population over the last 12 years is 5,043 where 4,777 students are attending the school for the academic year 2022-2023.
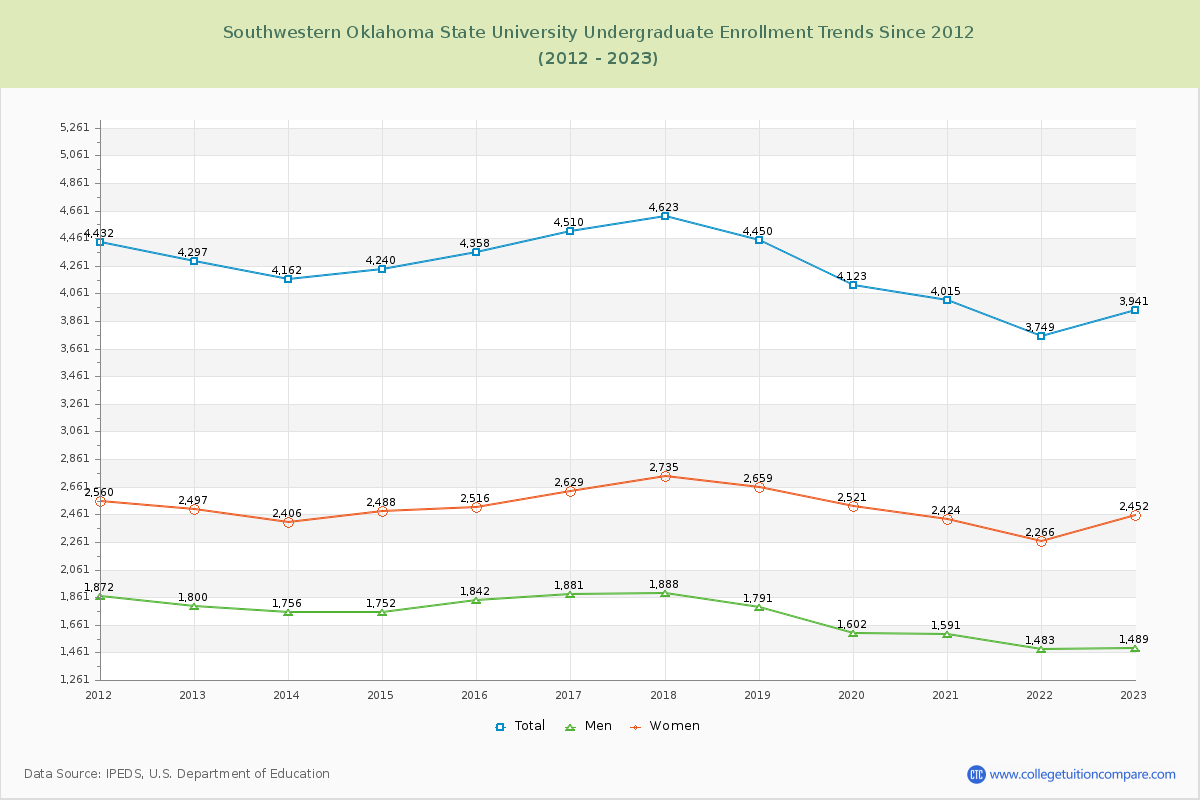
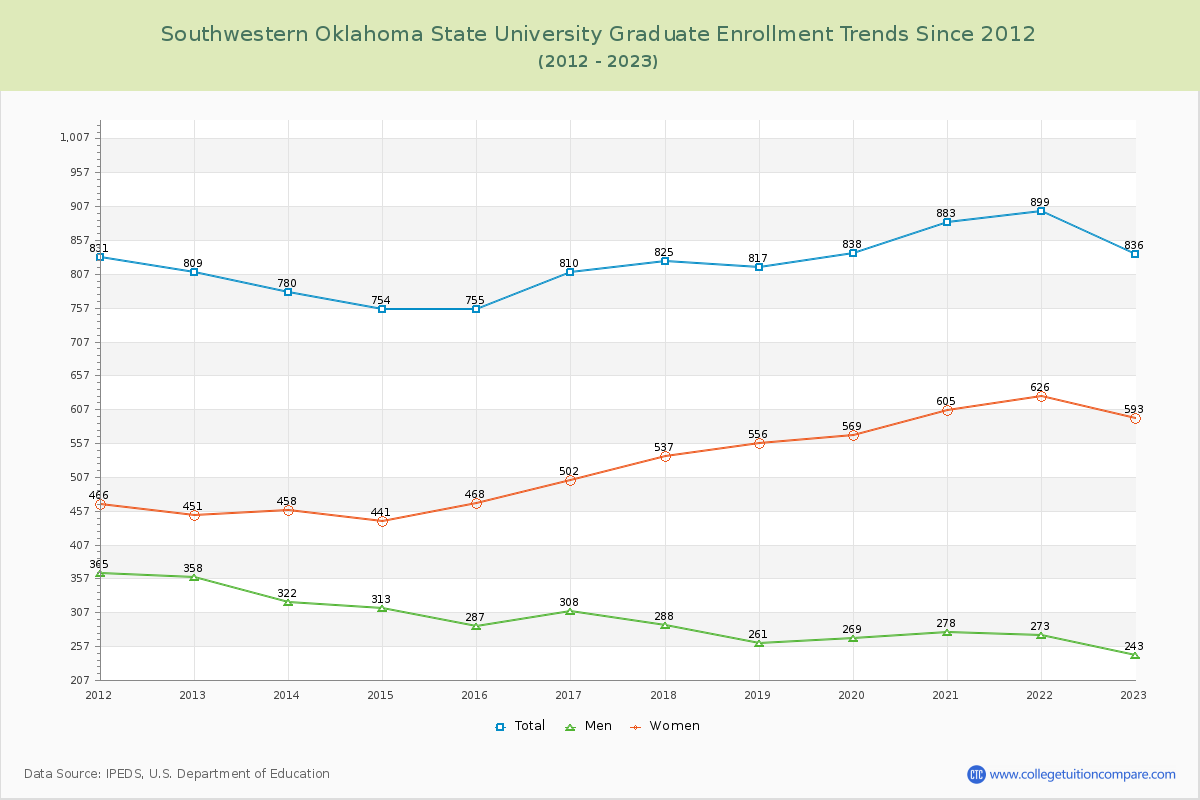
82.50% of total students is undergraduate students and 17.50% students is graduate students. The number of undergraduate students has decreased by 356 and the graduate enrollment has increased by 27 over past 10 years.
The female to male ratio is 1.76 to 1 and it means that there are more female students enrolled in SWOSU than male students.
The following table and chart illustrate the changes in student population by gender at Southwestern Oklahoma State University since 2012.
| Year | Total | Undergraduate | Graduate | ||||
|---|---|---|---|---|---|---|---|
| Total | Men | Women | Total | Men | Women | ||
| 2012-13 | 5,106 | 4,297 | 1,800 | 2,497 | 809 | 358 | 451 |
| 2013-14 | 4,942 -164 | 4,162 -135 | 1,756 -44 | 2,406 -91 | 780 -29 | 322 -36 | 458 7 |
| 2014-15 | 4,994 52 | 4,240 78 | 1,752 -4 | 2,488 82 | 754 -26 | 313 -9 | 441 -17 |
| 2015-16 | 5,113 119 | 4,358 118 | 1,842 90 | 2,516 28 | 755 1 | 287 -26 | 468 27 |
| 2016-17 | 5,320 207 | 4,510 152 | 1,881 39 | 2,629 113 | 810 55 | 308 21 | 502 34 |
| 2017-18 | 5,448 128 | 4,623 113 | 1,888 7 | 2,735 106 | 825 15 | 288 -20 | 537 35 |
| 2018-19 | 5,267 -181 | 4,450 -173 | 1,791 -97 | 2,659 -76 | 817 -8 | 261 -27 | 556 19 |
| 2019-20 | 4,961 -306 | 4,123 -327 | 1,602 -189 | 2,521 -138 | 838 21 | 269 8 | 569 13 |
| 2020-21 | 4,898 -63 | 4,015 -108 | 1,591 -11 | 2,424 -97 | 883 45 | 278 9 | 605 36 |
| 2021-22 | 4,648 -250 | 3,749 -266 | 1,483 -108 | 2,266 -158 | 899 16 | 273 -5 | 626 21 |
| 2022-23 | 4,777 129 | 3,941 192 | 1,489 6 | 2,452 186 | 836 -63 | 243 -30 | 593 -33 |
| Average | 5,043 | 4,224 | 1,716 | 2,508 | 819 | 291 | 528 |