Applicants, Acceptance Rate, Yield Trends at SWOSU

-18.95%

Applicants - since 2015

8.45%

Acceptance Rate

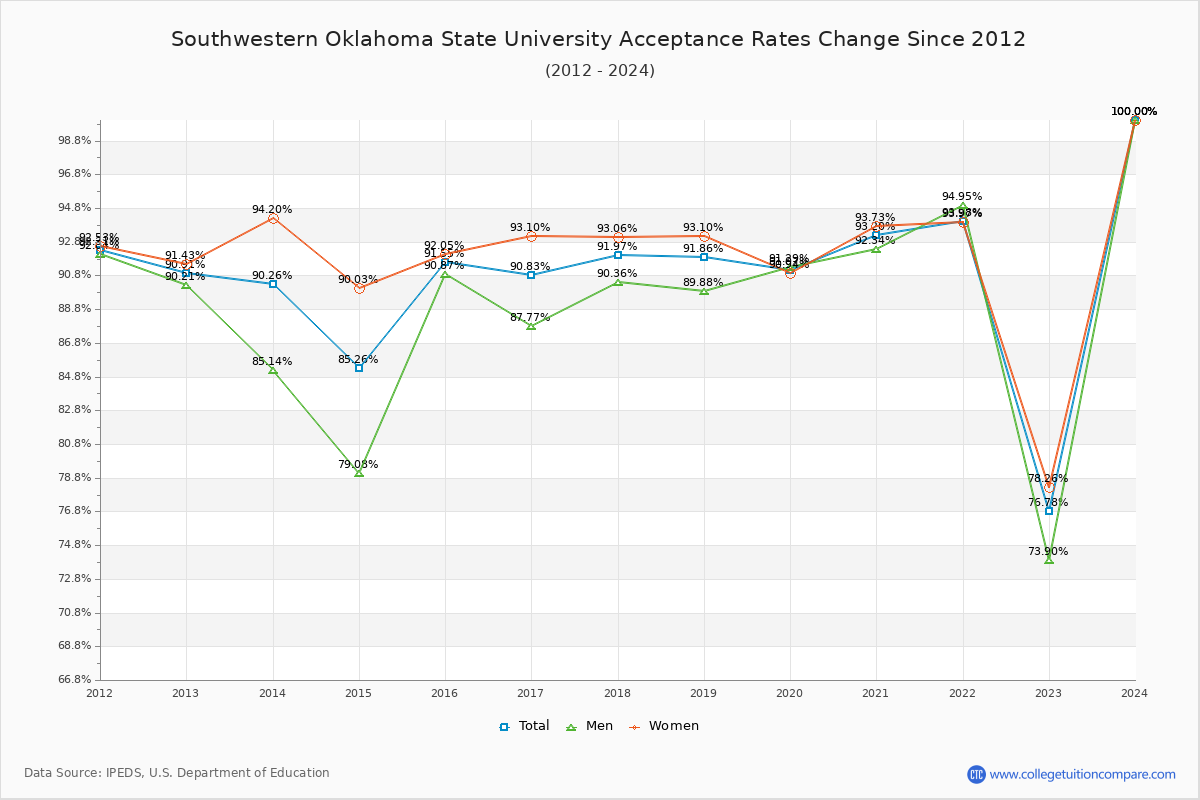
The average acceptance rate at SWOSU over the past 10 years is 91.25%, and the most recent acceptance rate is 100.00%. Compared to the previous year, it became much easier to gain admission to SWOSU in 2025. The acceptance rate at SWOSU is relatively high, giving applicants a greater chance of admission.

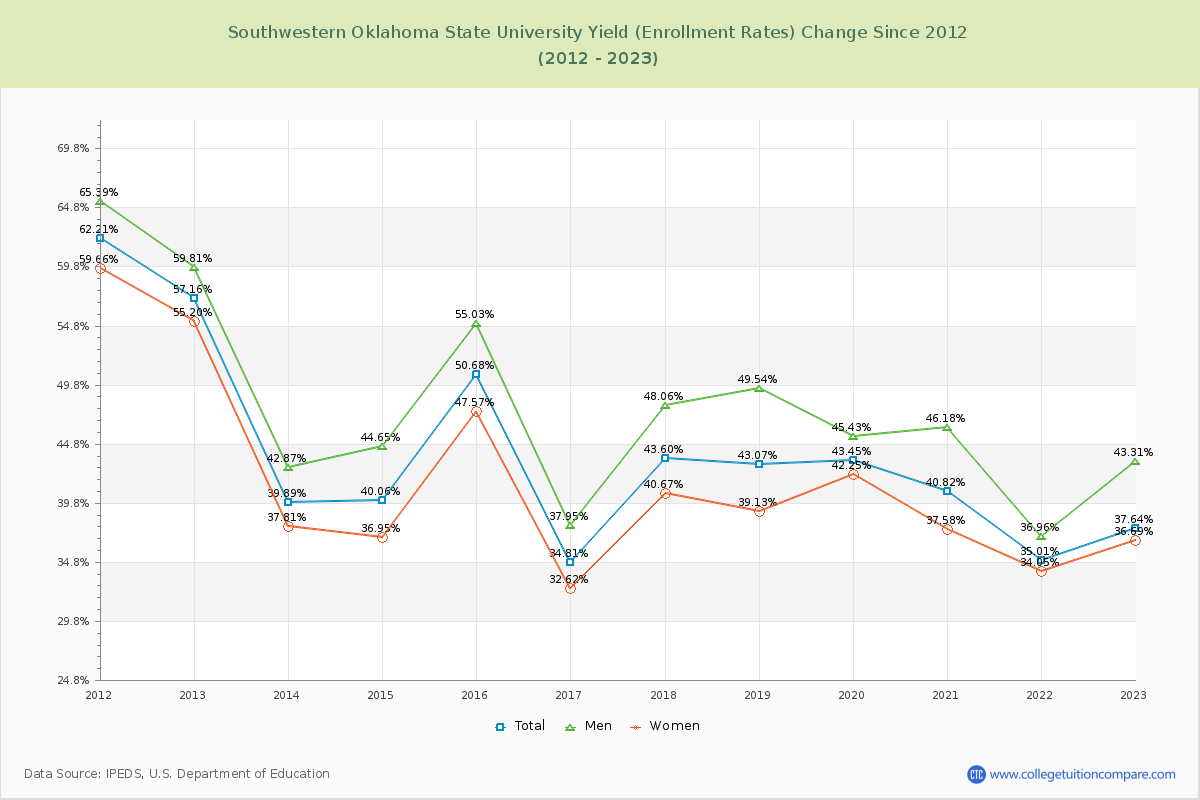
The average yield (enrollment rate) over the period is 41.41%, and the 2024 yield is 43.58%. Overall, the yield has decreased by 14.02% from 2015 to 2024.

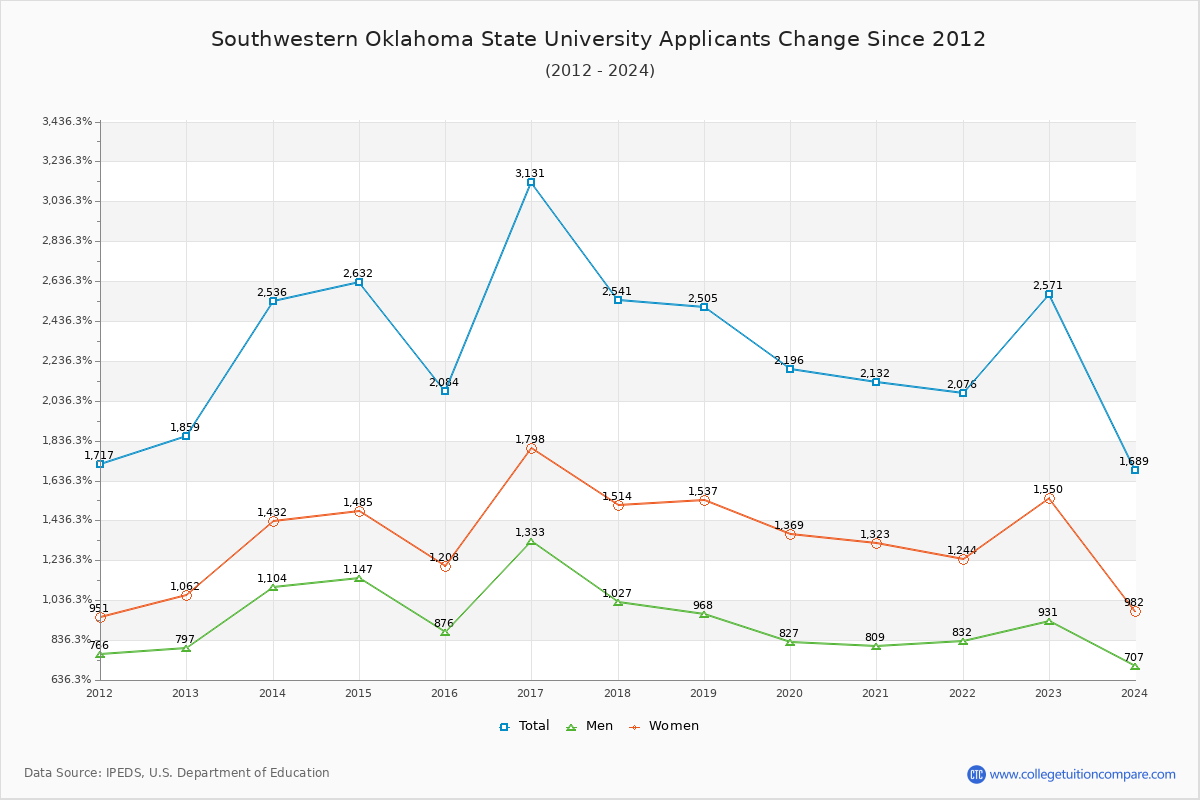
The number of SWOSU applicants decreased by 34.31% (882 applicants) compared to the previous year. Over the entire 9-year period, applicants decreased by 18.95% overall.

Key Takeaways: SWOSU Admission Metrics

Acceptance Rate Overview

The current acceptance rate for the 2025 admission cycle is 100.00%, showing a decreasing selectivity trend. This suggests that SWOSU is admitting a higher proportion of applicants, which may indicate either an increase in application quality or a strategic enrollment decision by the institution.

Yield Rate & Enrollment Patterns

The admission yield (the percentage of admitted students who enroll) for the 2025 academic year is 43.58%. The declining yield trend suggests that a lower percentage of admitted students are choosing to enroll at SWOSU. This pattern may reflect increased competition from peer institutions, changing student demographics, or shifts in institutional enrollment strategy.

Application Volume & Admission Trends

For the 2025 admission cycle, SWOSU received approximately 1,689 applications, admitted 1,689 students, and enrolled 736 students. The declining application volume may indicate shifts in student interest patterns or broader demographic changes affecting college enrollment. Understanding these trends is crucial for prospective students and families assessing SWOSU's position in the competitive admissions landscape.

Acceptance Rate Changes

SWOSU 10-Year Admission Rate Summary: The acceptance rate trends at SWOSU over the past decade show a relatively stable trend, with fluctuations in both directions. The average acceptance rate over this period is 91.25%, while the most recent rate stands at 100.00%. This data reflects the institution's evolving competitiveness in the higher education admissions landscape.

For the most recent admission cycle (2025), the acceptance rate is 100.00%. By gender, the average acceptance rate for men is 81.14% and for women is 82.82%.

The following table and chart show how acceptance rates at SWOSU have changed over the past 10 years (2015-2024).

YearTotalMenWomen
2015-16 91.55% 90.87% 92.05%
2016-17 90.83%
-0.72%
87.77%
-3.10%
93.10%
1.05%
2017-18 91.97%
1.14%
90.36%
2.59%
93.06%
-0.04%
2018-19 91.86%
-0.12%
89.88%
-0.48%
93.10%
0.04%
2019-20 91.07%
-0.78%
91.29%
1.42%
90.94%
-2.16%
2020-21 93.20%
2.12%
92.34%
1.04%
93.73%
2.78%
2021-22 93.98%
0.78%
94.95%
2.62%
93.97%
0.24%
2022-23 76.78%
-17.20%
73.90%
-21.05%
78.26%
-15.71%
2023-24 100.00%
23.22%
100.00%
26.10%
100.00%
21.74%
Average 91.25% 90.15% 92.02%
Southwestern Oklahoma State University Acceptance Rate Trends Over Time - Historical Admission Rate Data Visualization Chart

Admission Yield (Enrollment Rate) Changes

SWOSU has demonstrated a decline in admission yield over the past 10 years. The institution's yield rate has decreased from 50.68% in 2015 to 43.58% in 2024, representing a 14.02% decrease. The 10-year average yield stands at 41.41%, reflecting weakening enrollment performance.

The following table and chart illustrate the changes in yield at SWOSU from 2015 to 2024. The admission yield has decreased by 14.02% over this period.

YearTotalMenWomen
2015-16 50.68% 55.03% 47.57%
2016-17 34.81%
-15.87%
37.95%
-17.08%
32.62%
-14.96%
2017-18 43.60%
8.79%
48.06%
10.11%
40.67%
8.05%
2018-19 43.07%
-0.53%
49.54%
1.48%
39.13%
-1.53%
2019-20 43.45%
0.38%
45.43%
-4.11%
42.25%
3.12%
2020-21 40.82%
-2.63%
46.18%
0.75%
37.58%
-4.67%
2021-22 35.01%
-5.81%
36.96%
-9.22%
34.05%
-3.53%
2022-23 37.64%
2.63%
43.31%
6.35%
36.69%
2.64%
2023-24 43.58%
5.94%
43.85%
0.53%
43.38%
6.70%
Average 41.41% 45.15% 39.33%
Southwestern Oklahoma State University enrollment rate trends chart showing historical yield changes from 2015 to 2024

Applicants, Admitted, and Enrolled Headcount Changes

Over the past 10 years, The average number of applicants is 2,325, the average number of admitted is 2,110, and the average number of first-year enrolled students is 868.

The number of SWOSU applicants decreased by 34.31% (882 applicants) compared to the previous year. Over the entire 9-year period, applicants decreased by 18.95% overall.

The following table and chart show the changes of applicants, admitted, and enrolled headcount at Southwestern Oklahoma State University from 2015 to 2024.

YearApplicantsAdmittedEnrolled
2015-16 2,084 1,908 967
2016-17 3,131
50.24%
2,844
49.06%
990
2.38%
2017-18 2,541
-18.84%
2,337
-17.83%
1,019
2.93%
2018-19 2,505
-1.42%
2,301
-1.54%
991
-2.75%
2019-20 2,196
-12.34%
2,000
-13.08%
869
-12.31%
2020-21 2,132
-2.91%
1,987
-0.65%
811
-6.67%
2021-22 2,076
-2.63%
1,951
-1.81%
683
-15.78%
2022-23 2,571
23.84%
1,974
1.18%
743
8.78%
2023-24 1,689
-34.31%
1,689
-14.44%
736
-0.94%
Average 2,325 2,110 868
Southwestern Oklahoma State University - 10 Year Applicants, Admissions, and Enrollment Trends Chart

Compare Acceptance Rate Change to Similar Colleges

The following table compares Southwestern Oklahoma State University' acceptance rate to similar schools.

20242025Change %
Southwestern Oklahoma State University100.00%--100.00%
University of Oklahoma-Norman Campus76.60%76.54%0.08%
Oklahoma State University-Main Campus75.04%70.93%5.79%
University of Central Oklahoma78.12%81.76%-4.45%
Rose State College---
Northeastern State University99.59%99.21%0.38%

Ratings & Review

Share your experiences and thoughts about Southwestern Oklahoma State University. It will be a great help to applicants and prospective students!