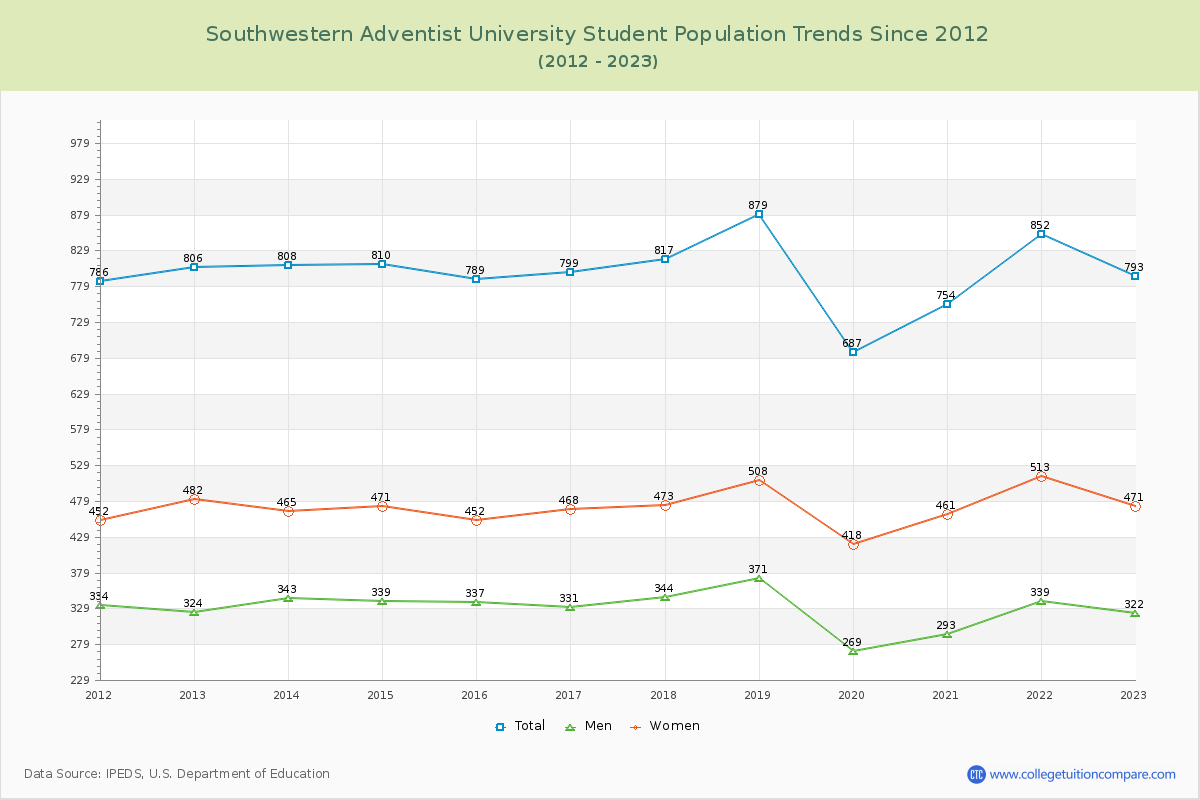
Student Population Changes
The average student population over the last 12 years is 799 where 793 students are attending the school for the academic year 2022-2023.
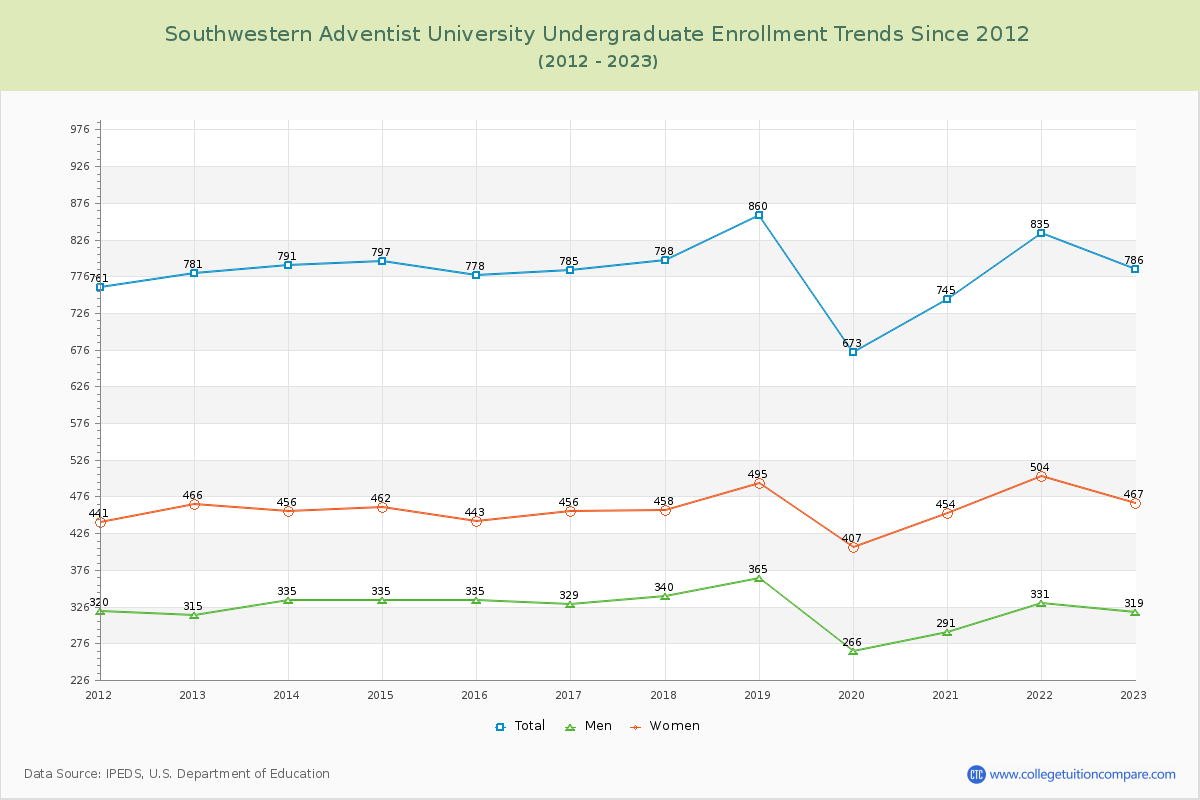
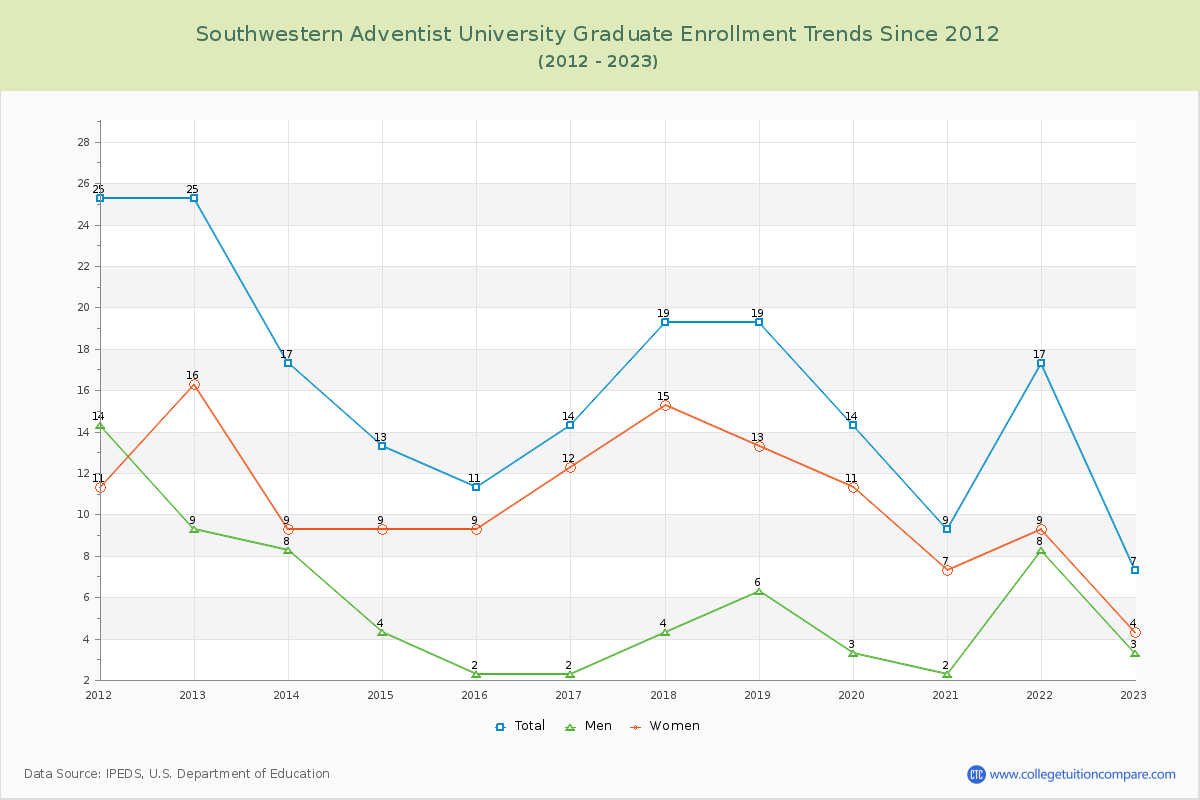
99.12% of total students is undergraduate students and 0.88% students is graduate students. The number of undergraduate students has increased by 5 and the graduate enrollment has decreased by 18 over past 10 years.
The female to male ratio is 1.46 to 1 and it means that there are more female students enrolled in Southwestern Adventist than male students.
The following table and chart illustrate the changes in student population by gender at Southwestern Adventist University since 2012.
| Year | Total | Undergraduate | Graduate | ||||
|---|---|---|---|---|---|---|---|
| Total | Men | Women | Total | Men | Women | ||
| 2012-13 | 806 | 781 | 315 | 466 | 25 | 9 | 16 |
| 2013-14 | 808 2 | 791 10 | 335 20 | 456 -10 | 17 -8 | 8 -1 | 9 -7 |
| 2014-15 | 810 2 | 797 6 | 335 0 | 462 6 | 13 -4 | 4 -4 | 9 0 |
| 2015-16 | 789 -21 | 778 -19 | 335 0 | 443 -19 | 11 -2 | 2 -2 | 9 0 |
| 2016-17 | 799 10 | 785 7 | 329 -6 | 456 13 | 14 3 | 2 0 | 12 3 |
| 2017-18 | 817 18 | 798 13 | 340 11 | 458 2 | 19 5 | 4 2 | 15 3 |
| 2018-19 | 879 62 | 860 62 | 365 25 | 495 37 | 19 0 | 6 2 | 13 -2 |
| 2019-20 | 687 -192 | 673 -187 | 266 -99 | 407 -88 | 14 -5 | 3 -3 | 11 -2 |
| 2020-21 | 754 67 | 745 72 | 291 25 | 454 47 | 9 -5 | 2 -1 | 7 -4 |
| 2021-22 | 852 98 | 835 90 | 331 40 | 504 50 | 17 8 | 8 6 | 9 2 |
| 2022-23 | 793 -59 | 786 -49 | 319 -12 | 467 -37 | 7 -10 | 3 -5 | 4 -5 |
| Average | 799 | 784 | 324 | 461 | 15 | 5 | 10 |