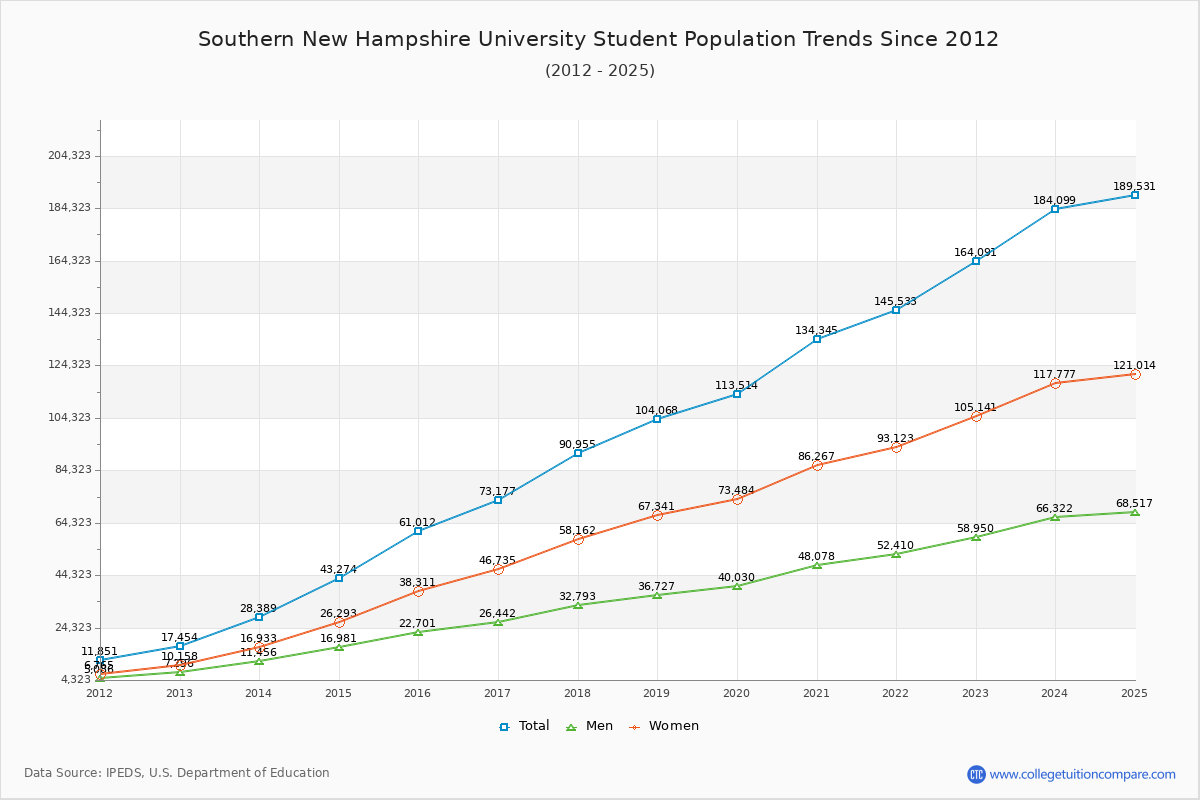
Student Population Changes
The average student population over the last 12 years is 88,710 where 164,091 students are attending the school for the academic year 2022-2023.
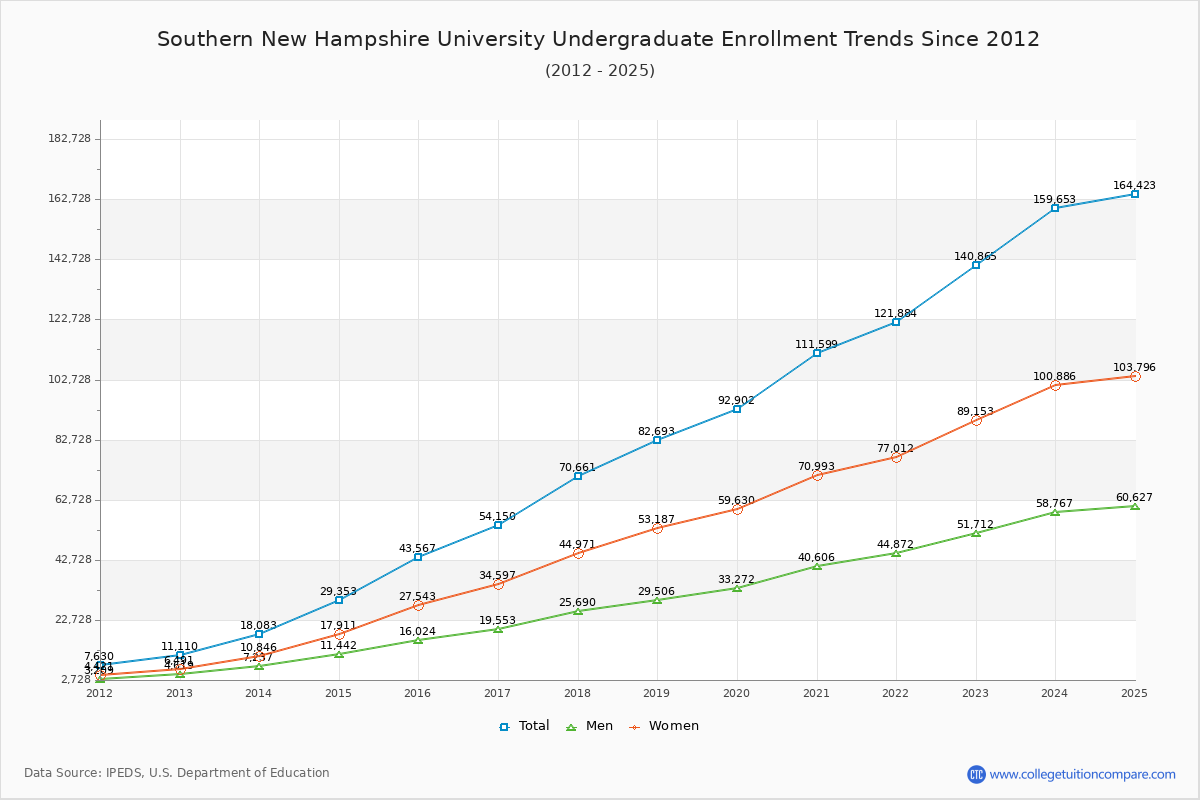
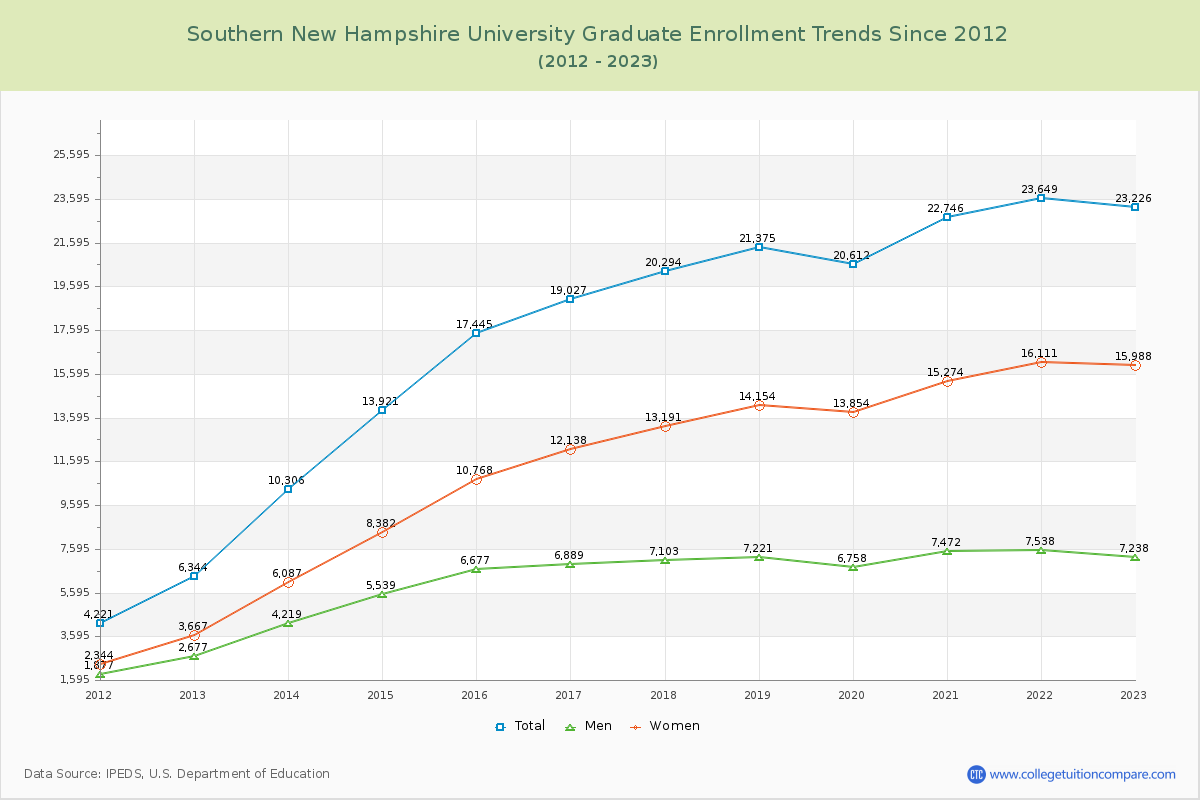
85.85% of total students is undergraduate students and 14.15% students is graduate students. The number of undergraduate students has increased by 129,755 and the graduate enrollment has increased by 16,882 over past 10 years.
The female to male ratio is 1.78 to 1 and it means that there are more female students enrolled in SNHU than male students.
The following table and chart illustrate the changes in student population by gender at Southern New Hampshire University since 2012.
| Year | Total | Undergraduate | Graduate | ||||
|---|---|---|---|---|---|---|---|
| Total | Men | Women | Total | Men | Women | ||
| 2012-13 | 17,454 | 11,110 | 4,619 | 6,491 | 6,344 | 2,677 | 3,667 |
| 2013-14 | 28,389 10,935 | 18,083 6,973 | 7,237 2,618 | 10,846 4,355 | 10,306 3,962 | 4,219 1,542 | 6,087 2,420 |
| 2014-15 | 43,274 14,885 | 29,353 11,270 | 11,442 4,205 | 17,911 7,065 | 13,921 3,615 | 5,539 1,320 | 8,382 2,295 |
| 2015-16 | 61,012 17,738 | 43,567 14,214 | 16,024 4,582 | 27,543 9,632 | 17,445 3,524 | 6,677 1,138 | 10,768 2,386 |
| 2016-17 | 73,177 12,165 | 54,150 10,583 | 19,553 3,529 | 34,597 7,054 | 19,027 1,582 | 6,889 212 | 12,138 1,370 |
| 2017-18 | 90,955 17,778 | 70,661 16,511 | 25,690 6,137 | 44,971 10,374 | 20,294 1,267 | 7,103 214 | 13,191 1,053 |
| 2018-19 | 104,068 13,113 | 82,693 12,032 | 29,506 3,816 | 53,187 8,216 | 21,375 1,081 | 7,221 118 | 14,154 963 |
| 2019-20 | 113,514 9,446 | 92,902 10,209 | 33,272 3,766 | 59,630 6,443 | 20,612 -763 | 6,758 -463 | 13,854 -300 |
| 2020-21 | 134,345 20,831 | 111,599 18,697 | 40,606 7,334 | 70,993 11,363 | 22,746 2,134 | 7,472 714 | 15,274 1,420 |
| 2021-22 | 145,533 11,188 | 121,884 10,285 | 44,872 4,266 | 77,012 6,019 | 23,649 903 | 7,538 66 | 16,111 837 |
| 2022-23 | 164,091 18,558 | 140,865 18,981 | 51,712 6,840 | 89,153 12,141 | 23,226 -423 | 7,238 -300 | 15,988 -123 |
| Average | 88,710 | 70,624 | 25,867 | 44,758 | 18,086 | 6,303 | 11,783 |