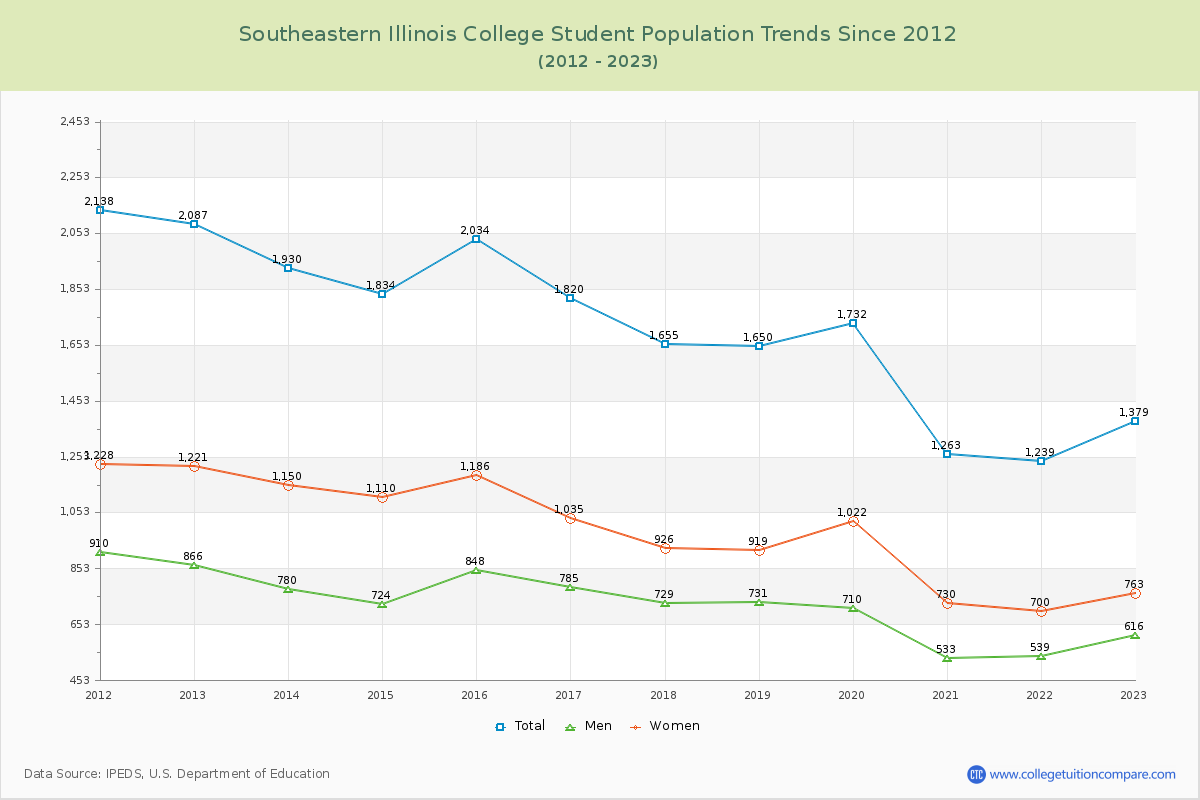
Student Population Changes
The average student population over the last 12 years is 1,693 where 1,379 students are attending the school for the academic year 2022-2023.
The female to male ratio is 1.24 to 1 and it means that there are slightly more female students enrolled in SIC than male students.
The following table and chart illustrate the changes in student population by gender at Southeastern Illinois College since 2012.
| Year | Total | Men | Women |
|---|---|---|---|
| 2012-13 | 2,087 | 866 | 1,221 |
| 2013-14 | 1,930 -157 | 780 -86 | 1,150 -71 |
| 2014-15 | 1,834 -96 | 724 -56 | 1,110 -40 |
| 2015-16 | 2,034 200 | 848 124 | 1,186 76 |
| 2016-17 | 1,820 -214 | 785 -63 | 1,035 -151 |
| 2017-18 | 1,655 -165 | 729 -56 | 926 -109 |
| 2018-19 | 1,650 -5 | 731 2 | 919 -7 |
| 2019-20 | 1,732 82 | 710 -21 | 1,022 103 |
| 2020-21 | 1,263 -469 | 533 -177 | 730 -292 |
| 2021-22 | 1,239 -24 | 539 6 | 700 -30 |
| 2022-23 | 1,379 140 | 616 77 | 763 63 |
| Average | 1,693 | 715 | 978 |