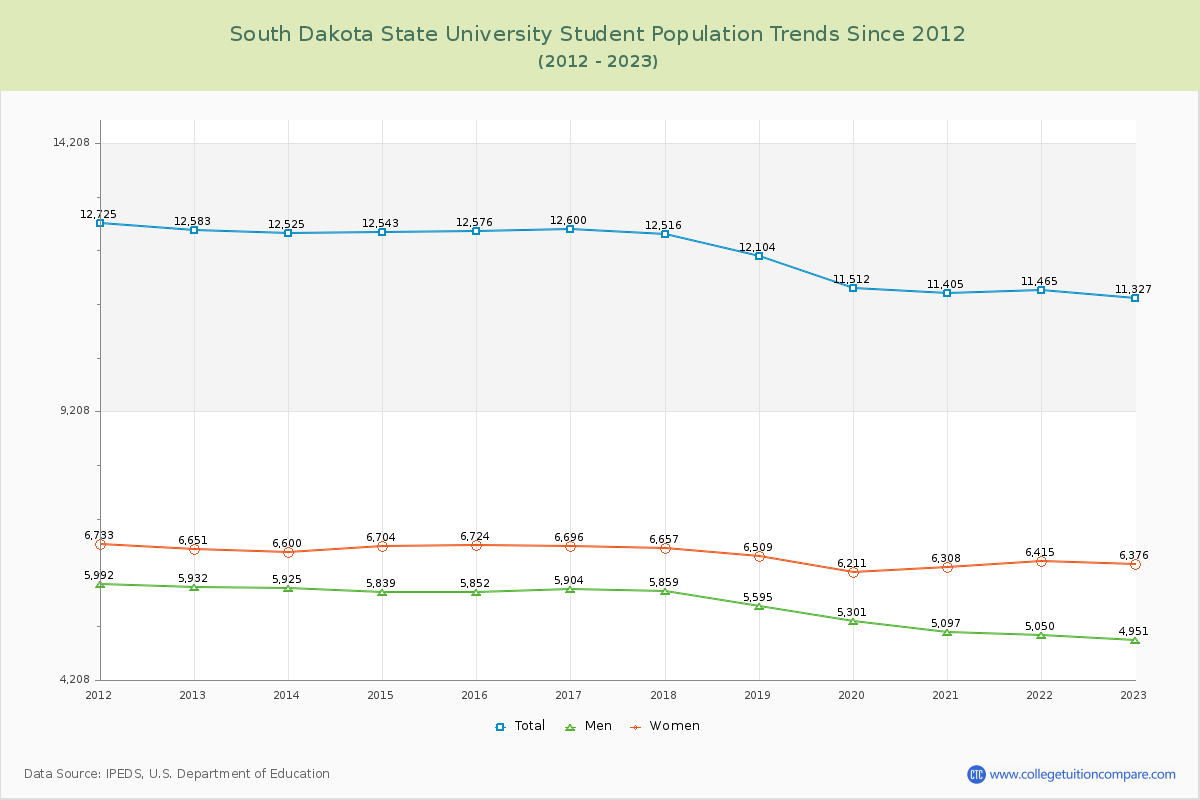
Student Population Changes
The average student population over the last 12 years is 12,105 where 11,327 students are attending the school for the academic year 2022-2023.
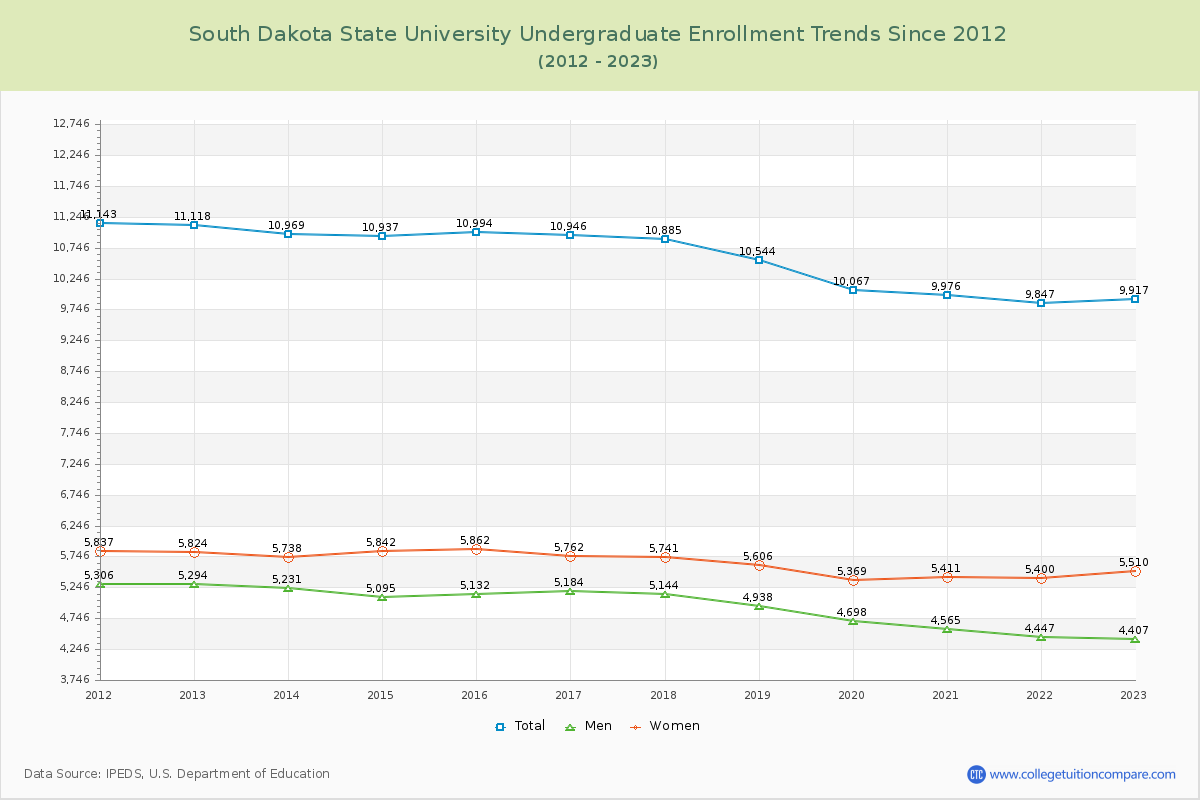
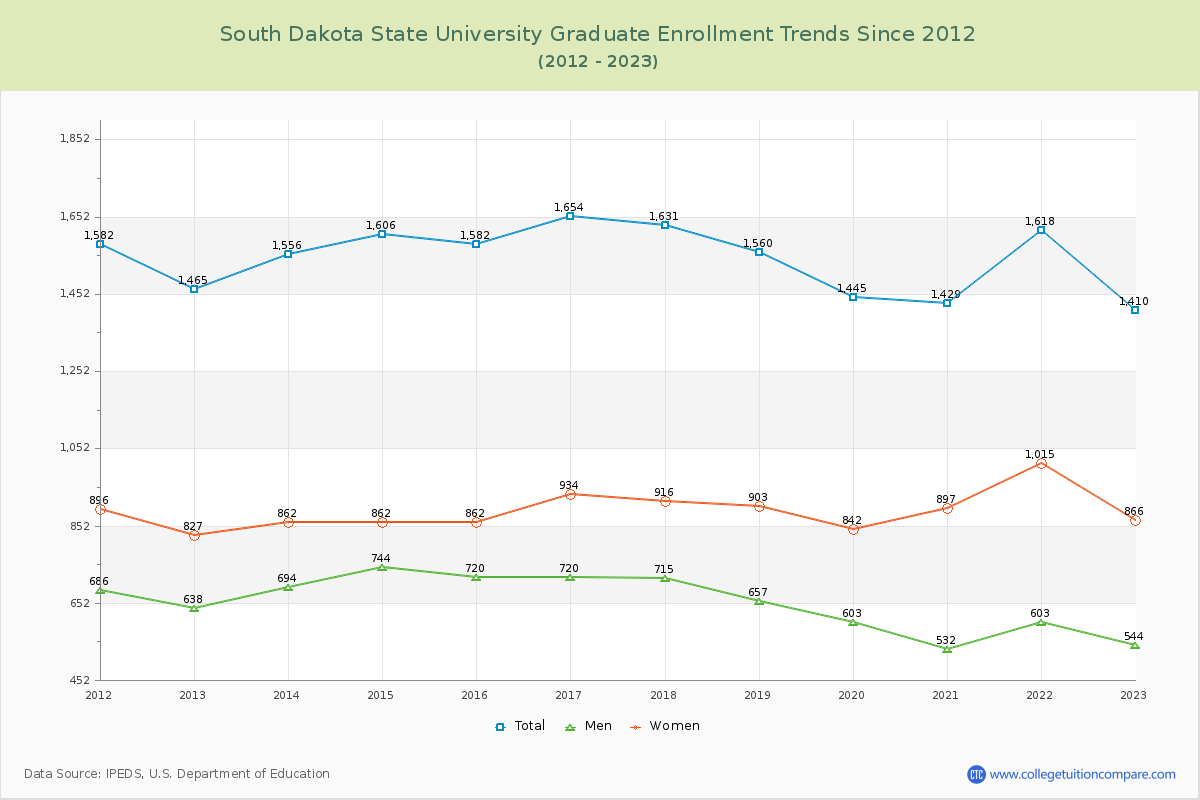
87.55% of total students is undergraduate students and 12.45% students is graduate students. The number of undergraduate students has decreased by 1,201 and the graduate enrollment has decreased by 55 over past 10 years.
The female to male ratio is 1.29 to 1 and it means that there are slightly more female students enrolled in South Dakota State than male students.
The following table and chart illustrate the changes in student population by gender at South Dakota State University since 2012.
| Year | Total | Undergraduate | Graduate | ||||
|---|---|---|---|---|---|---|---|
| Total | Men | Women | Total | Men | Women | ||
| 2012-13 | 12,583 | 11,118 | 5,294 | 5,824 | 1,465 | 638 | 827 |
| 2013-14 | 12,525 -58 | 10,969 -149 | 5,231 -63 | 5,738 -86 | 1,556 91 | 694 56 | 862 35 |
| 2014-15 | 12,543 18 | 10,937 -32 | 5,095 -136 | 5,842 104 | 1,606 50 | 744 50 | 862 0 |
| 2015-16 | 12,576 33 | 10,994 57 | 5,132 37 | 5,862 20 | 1,582 -24 | 720 -24 | 862 0 |
| 2016-17 | 12,600 24 | 10,946 -48 | 5,184 52 | 5,762 -100 | 1,654 72 | 720 0 | 934 72 |
| 2017-18 | 12,516 -84 | 10,885 -61 | 5,144 -40 | 5,741 -21 | 1,631 -23 | 715 -5 | 916 -18 |
| 2018-19 | 12,104 -412 | 10,544 -341 | 4,938 -206 | 5,606 -135 | 1,560 -71 | 657 -58 | 903 -13 |
| 2019-20 | 11,512 -592 | 10,067 -477 | 4,698 -240 | 5,369 -237 | 1,445 -115 | 603 -54 | 842 -61 |
| 2020-21 | 11,405 -107 | 9,976 -91 | 4,565 -133 | 5,411 42 | 1,429 -16 | 532 -71 | 897 55 |
| 2021-22 | 11,465 60 | 9,847 -129 | 4,447 -118 | 5,400 -11 | 1,618 189 | 603 71 | 1,015 118 |
| 2022-23 | 11,327 -138 | 9,917 70 | 4,407 -40 | 5,510 110 | 1,410 -208 | 544 -59 | 866 -149 |
| Average | 12,105 | 10,564 | 4,921 | 5,642 | 1,541 | 652 | 890 |