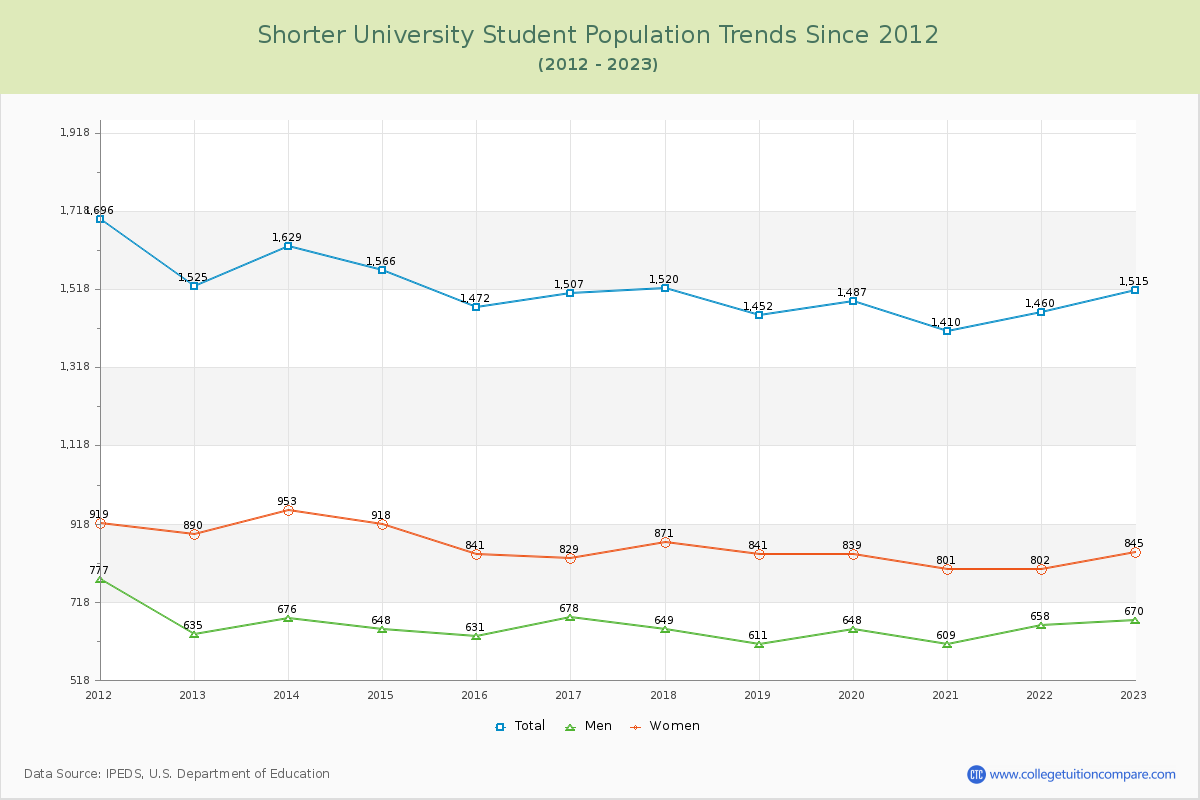
Student Population Changes
The average student population over the last 12 years is 1,504 where 1,515 students are attending the school for the academic year 2022-2023.
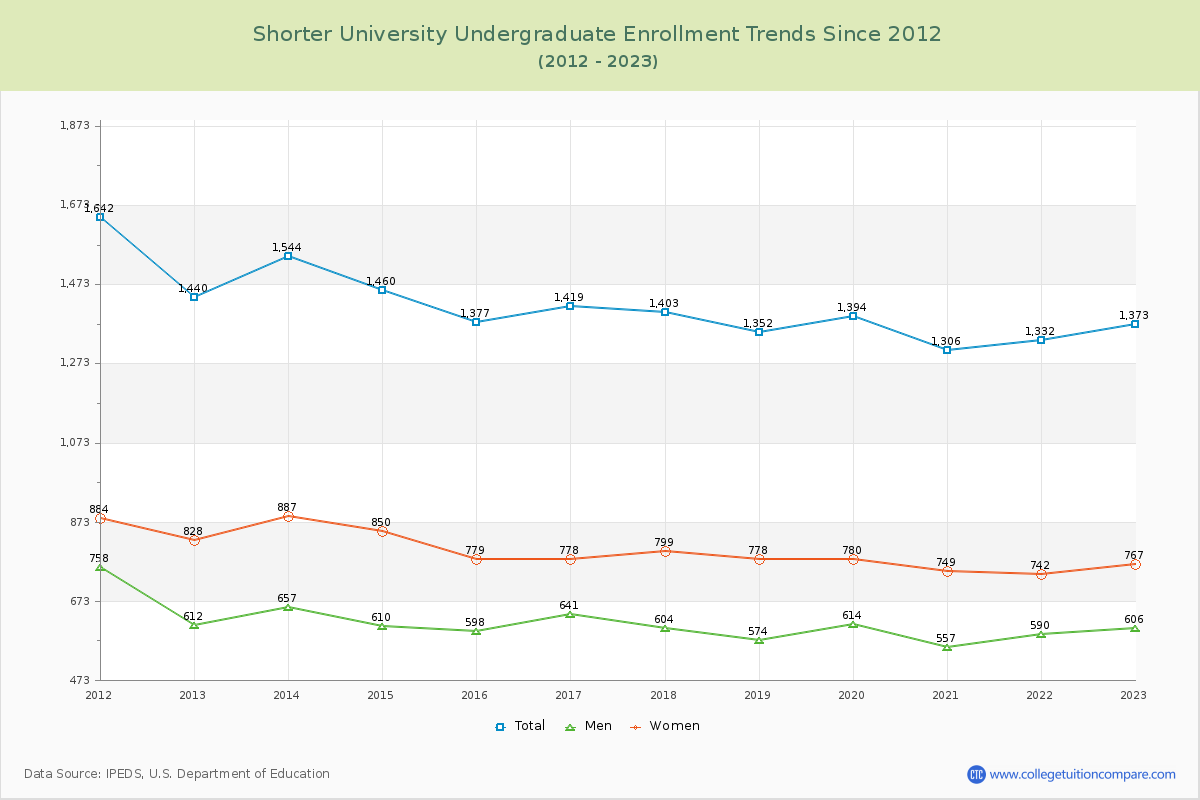
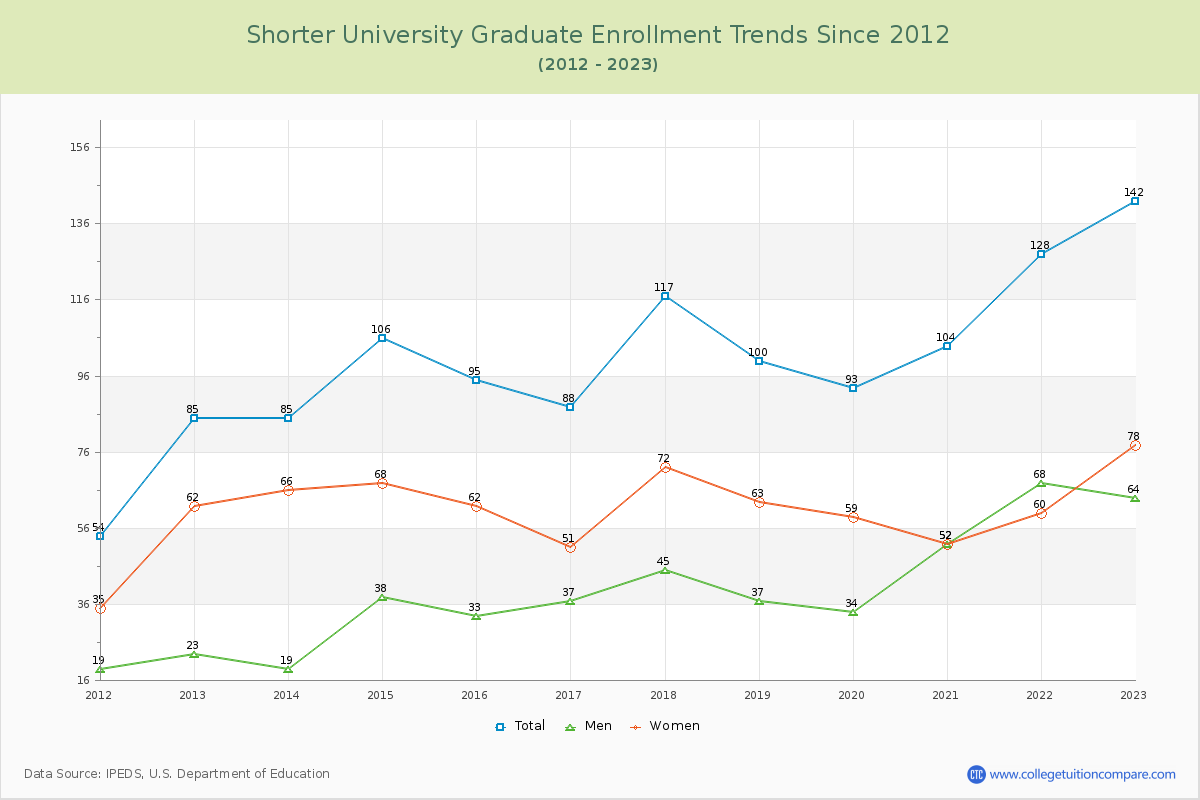
90.63% of total students is undergraduate students and 9.37% students is graduate students. The number of undergraduate students has decreased by 67 and the graduate enrollment has increased by 57 over past 10 years.
The female to male ratio is 1.26 to 1 and it means that there are slightly more female students enrolled in Shorter than male students.
The following table and chart illustrate the changes in student population by gender at Shorter University since 2012.
| Year | Total | Undergraduate | Graduate | ||||
|---|---|---|---|---|---|---|---|
| Total | Men | Women | Total | Men | Women | ||
| 2012-13 | 1,525 | 1,440 | 612 | 828 | 85 | 23 | 62 |
| 2013-14 | 1,629 104 | 1,544 104 | 657 45 | 887 59 | 85 0 | 19 -4 | 66 4 |
| 2014-15 | 1,566 -63 | 1,460 -84 | 610 -47 | 850 -37 | 106 21 | 38 19 | 68 2 |
| 2015-16 | 1,472 -94 | 1,377 -83 | 598 -12 | 779 -71 | 95 -11 | 33 -5 | 62 -6 |
| 2016-17 | 1,507 35 | 1,419 42 | 641 43 | 778 -1 | 88 -7 | 37 4 | 51 -11 |
| 2017-18 | 1,520 13 | 1,403 -16 | 604 -37 | 799 21 | 117 29 | 45 8 | 72 21 |
| 2018-19 | 1,452 -68 | 1,352 -51 | 574 -30 | 778 -21 | 100 -17 | 37 -8 | 63 -9 |
| 2019-20 | 1,487 35 | 1,394 42 | 614 40 | 780 2 | 93 -7 | 34 -3 | 59 -4 |
| 2020-21 | 1,410 -77 | 1,306 -88 | 557 -57 | 749 -31 | 104 11 | 52 18 | 52 -7 |
| 2021-22 | 1,460 50 | 1,332 26 | 590 33 | 742 -7 | 128 24 | 68 16 | 60 8 |
| 2022-23 | 1,515 55 | 1,373 41 | 606 16 | 767 25 | 142 14 | 64 -4 | 78 18 |
| Average | 1,504 | 1,400 | 606 | 794 | 104 | 41 | 63 |