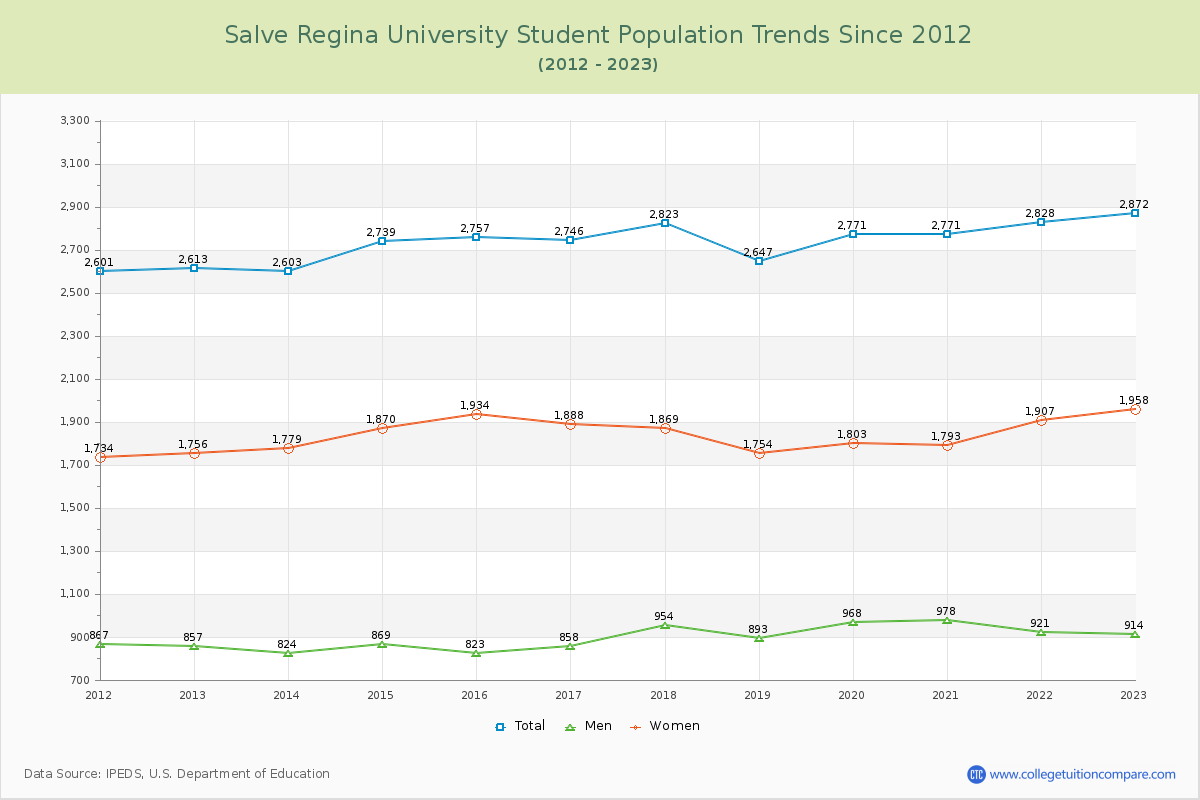
Student Population Changes
The average student population over the last 12 years is 2,743 where 2,872 students are attending the school for the academic year 2022-2023.
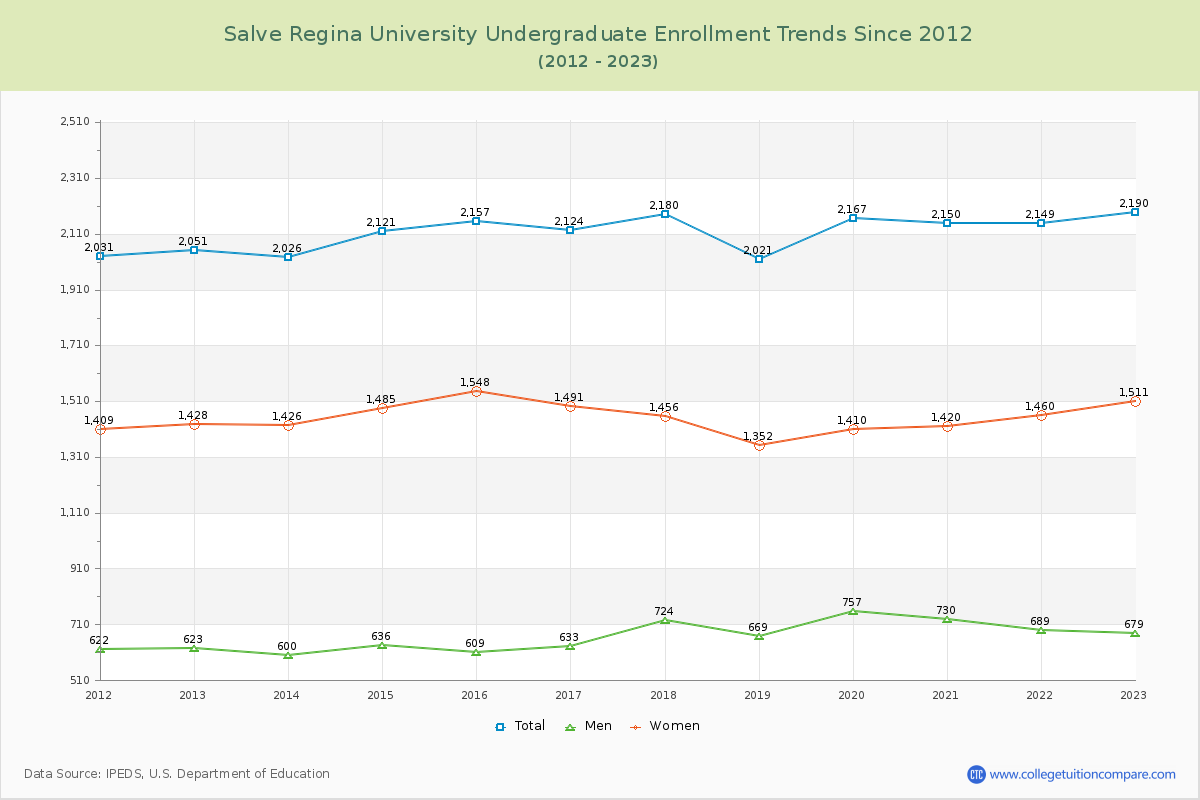
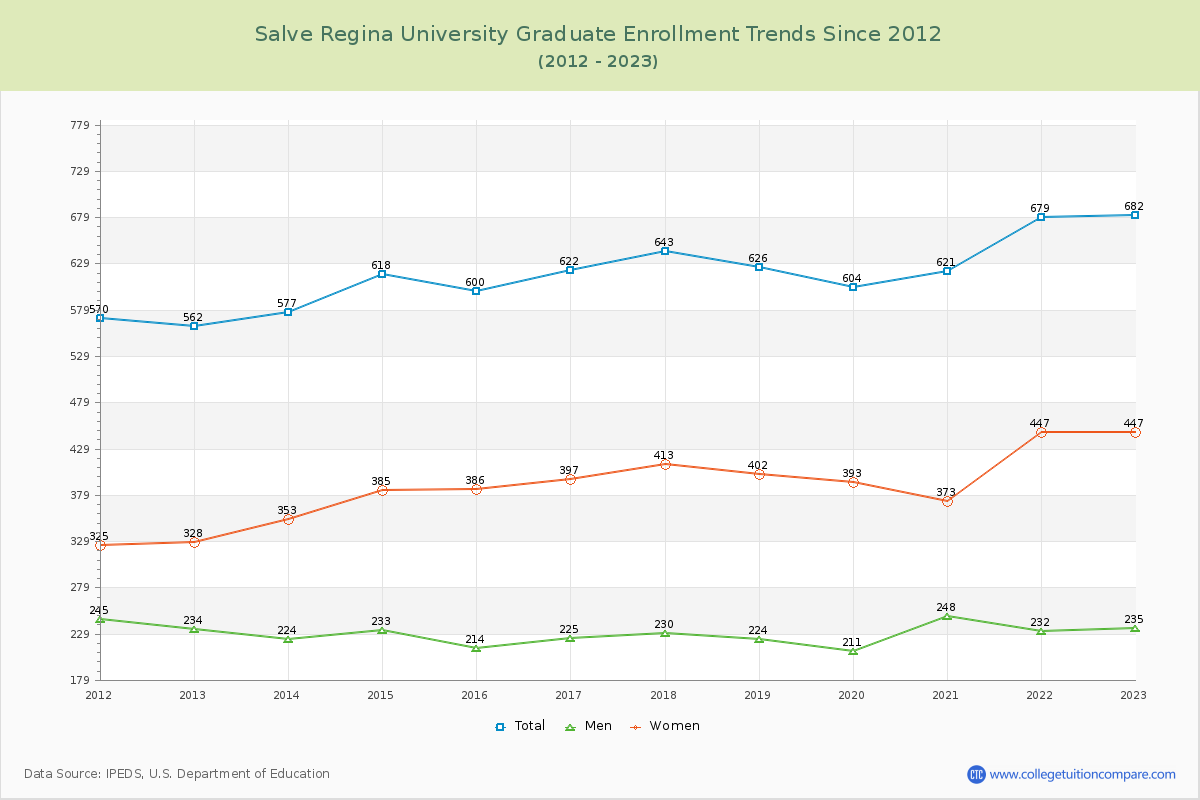
76.25% of total students is undergraduate students and 23.75% students is graduate students. The number of undergraduate students has increased by 139 and the graduate enrollment has increased by 120 over past 10 years.
The female to male ratio is 2.14 to 1 and it means that there are far more female students enrolled in Salve Regina than male students.
The following table and chart illustrate the changes in student population by gender at Salve Regina University since 2012.
| Year | Total | Undergraduate | Graduate | ||||
|---|---|---|---|---|---|---|---|
| Total | Men | Women | Total | Men | Women | ||
| 2012-13 | 2,613 | 2,051 | 623 | 1,428 | 562 | 234 | 328 |
| 2013-14 | 2,603 -10 | 2,026 -25 | 600 -23 | 1,426 -2 | 577 15 | 224 -10 | 353 25 |
| 2014-15 | 2,739 136 | 2,121 95 | 636 36 | 1,485 59 | 618 41 | 233 9 | 385 32 |
| 2015-16 | 2,757 18 | 2,157 36 | 609 -27 | 1,548 63 | 600 -18 | 214 -19 | 386 1 |
| 2016-17 | 2,746 -11 | 2,124 -33 | 633 24 | 1,491 -57 | 622 22 | 225 11 | 397 11 |
| 2017-18 | 2,823 77 | 2,180 56 | 724 91 | 1,456 -35 | 643 21 | 230 5 | 413 16 |
| 2018-19 | 2,647 -176 | 2,021 -159 | 669 -55 | 1,352 -104 | 626 -17 | 224 -6 | 402 -11 |
| 2019-20 | 2,771 124 | 2,167 146 | 757 88 | 1,410 58 | 604 -22 | 211 -13 | 393 -9 |
| 2020-21 | 2,771 0 | 2,150 -17 | 730 -27 | 1,420 10 | 621 17 | 248 37 | 373 -20 |
| 2021-22 | 2,828 57 | 2,149 -1 | 689 -41 | 1,460 40 | 679 58 | 232 -16 | 447 74 |
| 2022-23 | 2,872 44 | 2,190 41 | 679 -10 | 1,511 51 | 682 3 | 235 3 | 447 0 |
| Average | 2,743 | 2,121 | 668 | 1,453 | 621 | 228 | 393 |