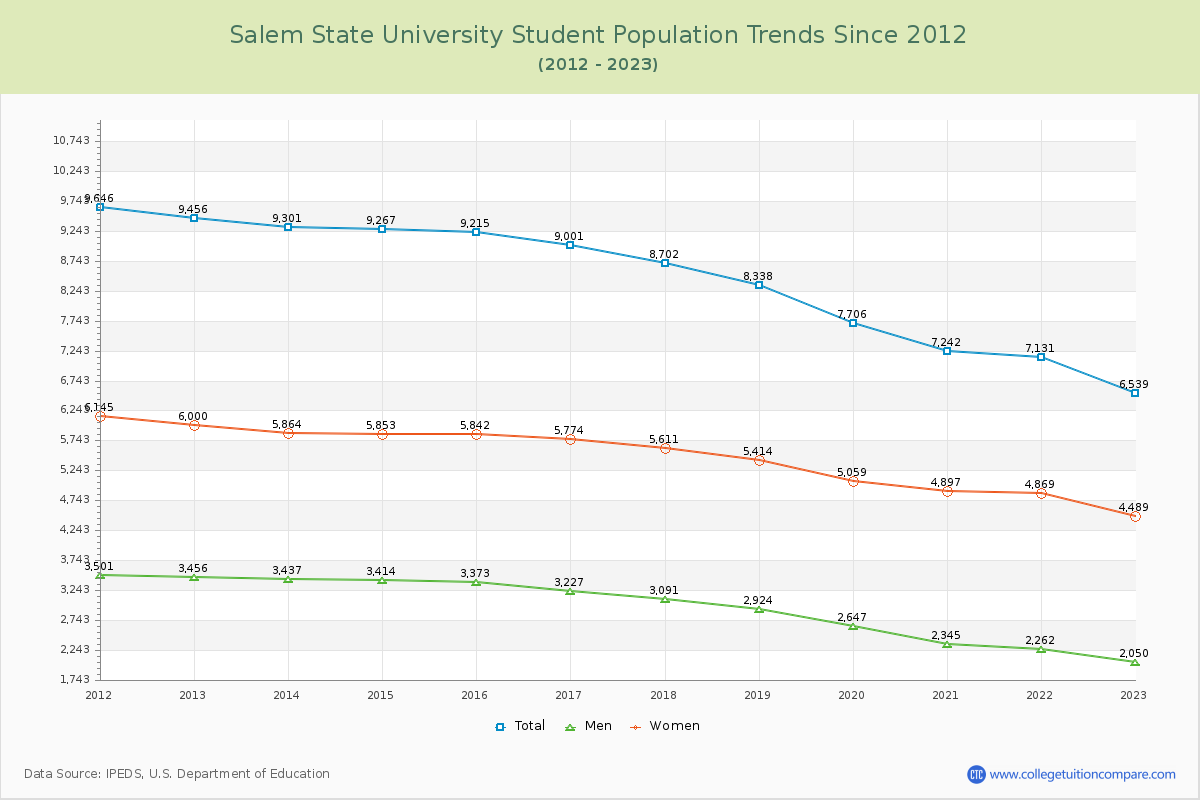
Student Population Changes
The average student population over the last 12 years is 8,354 where 6,539 students are attending the school for the academic year 2022-2023.
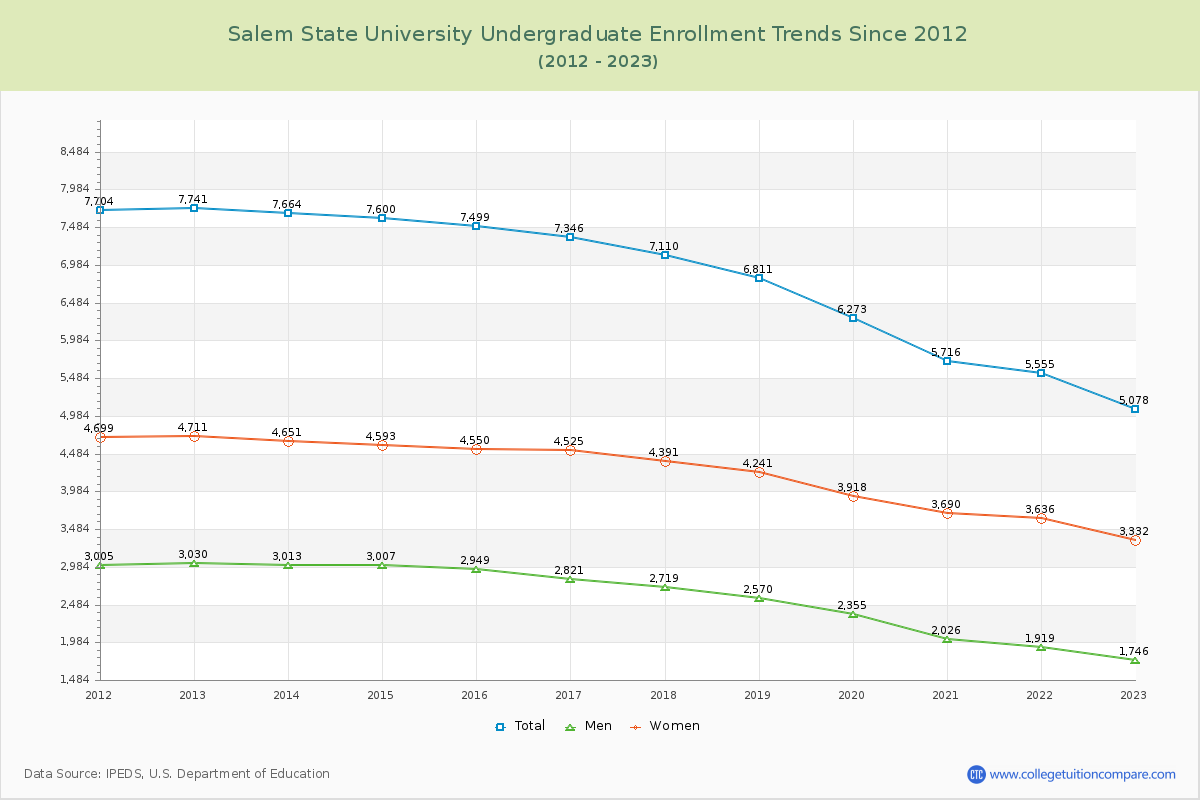
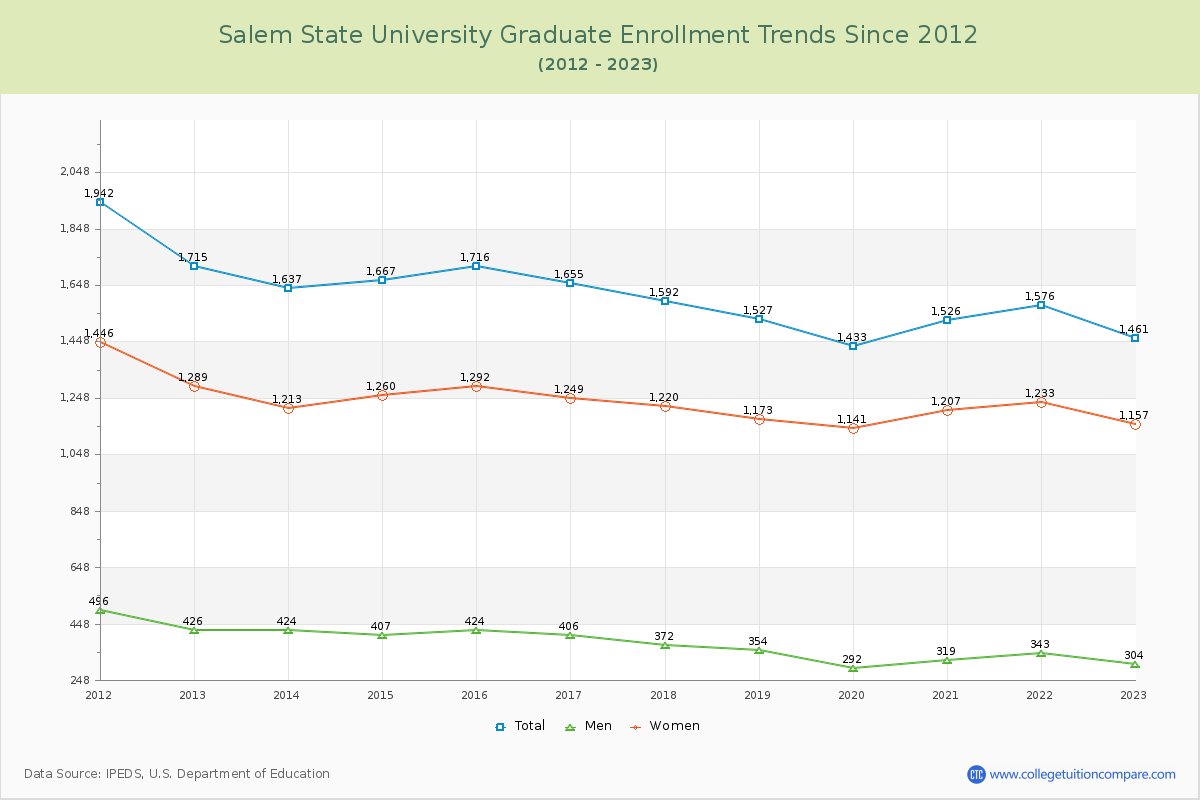
77.66% of total students is undergraduate students and 22.34% students is graduate students. The number of undergraduate students has decreased by 2,663 and the graduate enrollment has decreased by 254 over past 10 years.
The female to male ratio is 2.19 to 1 and it means that there are far more female students enrolled in Salem State than male students.
The following table and chart illustrate the changes in student population by gender at Salem State University since 2012.
| Year | Total | Undergraduate | Graduate | ||||
|---|---|---|---|---|---|---|---|
| Total | Men | Women | Total | Men | Women | ||
| 2012-13 | 9,456 | 7,741 | 3,030 | 4,711 | 1,715 | 426 | 1,289 |
| 2013-14 | 9,301 -155 | 7,664 -77 | 3,013 -17 | 4,651 -60 | 1,637 -78 | 424 -2 | 1,213 -76 |
| 2014-15 | 9,267 -34 | 7,600 -64 | 3,007 -6 | 4,593 -58 | 1,667 30 | 407 -17 | 1,260 47 |
| 2015-16 | 9,215 -52 | 7,499 -101 | 2,949 -58 | 4,550 -43 | 1,716 49 | 424 17 | 1,292 32 |
| 2016-17 | 9,001 -214 | 7,346 -153 | 2,821 -128 | 4,525 -25 | 1,655 -61 | 406 -18 | 1,249 -43 |
| 2017-18 | 8,702 -299 | 7,110 -236 | 2,719 -102 | 4,391 -134 | 1,592 -63 | 372 -34 | 1,220 -29 |
| 2018-19 | 8,338 -364 | 6,811 -299 | 2,570 -149 | 4,241 -150 | 1,527 -65 | 354 -18 | 1,173 -47 |
| 2019-20 | 7,706 -632 | 6,273 -538 | 2,355 -215 | 3,918 -323 | 1,433 -94 | 292 -62 | 1,141 -32 |
| 2020-21 | 7,242 -464 | 5,716 -557 | 2,026 -329 | 3,690 -228 | 1,526 93 | 319 27 | 1,207 66 |
| 2021-22 | 7,131 -111 | 5,555 -161 | 1,919 -107 | 3,636 -54 | 1,576 50 | 343 24 | 1,233 26 |
| 2022-23 | 6,539 -592 | 5,078 -477 | 1,746 -173 | 3,332 -304 | 1,461 -115 | 304 -39 | 1,157 -76 |
| Average | 8,354 | 6,763 | 2,560 | 4,203 | 1,591 | 370 | 1,221 |