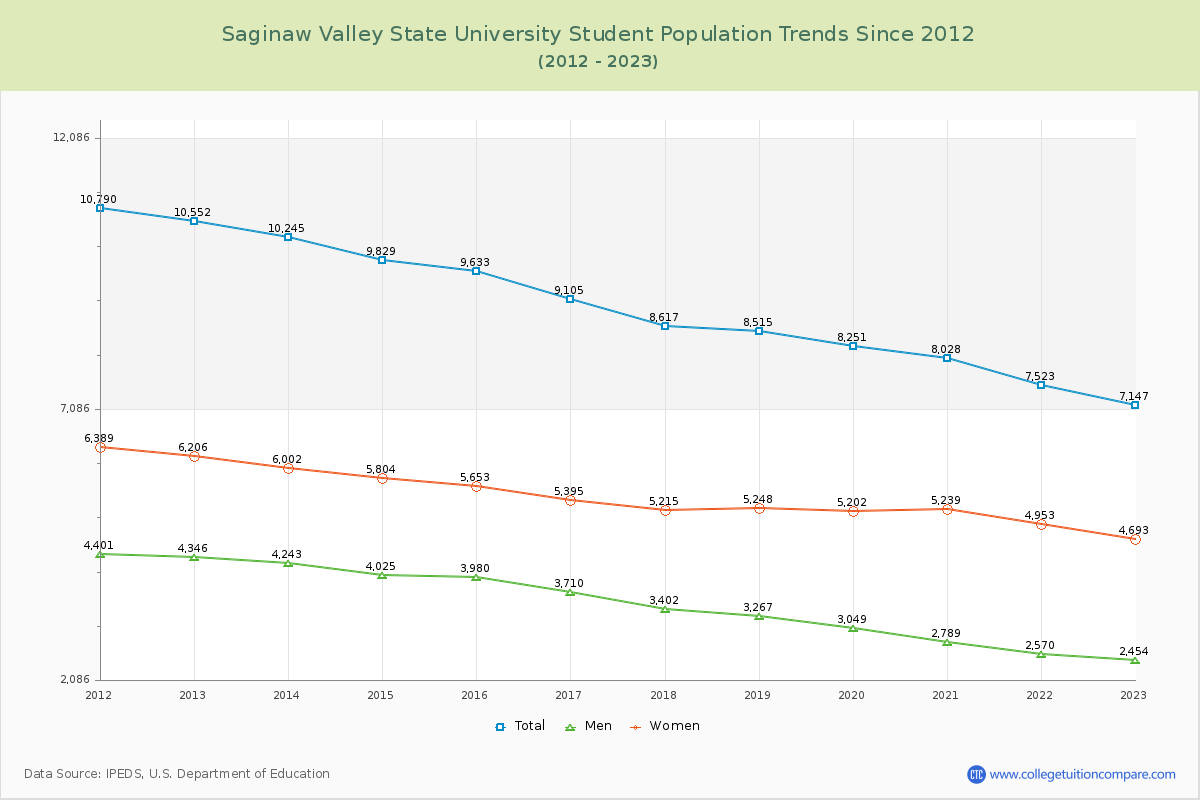
Student Population Changes
The average student population over the last 12 years is 8,859 where 7,147 students are attending the school for the academic year 2022-2023.
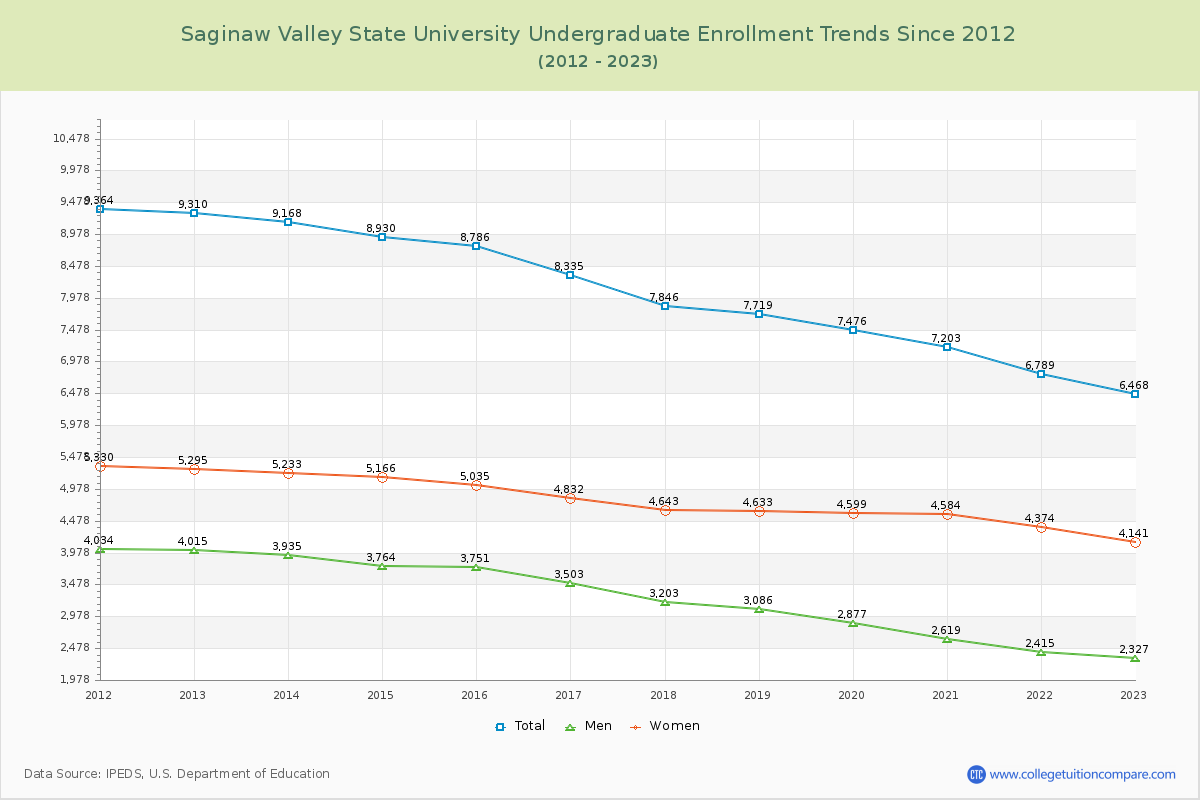
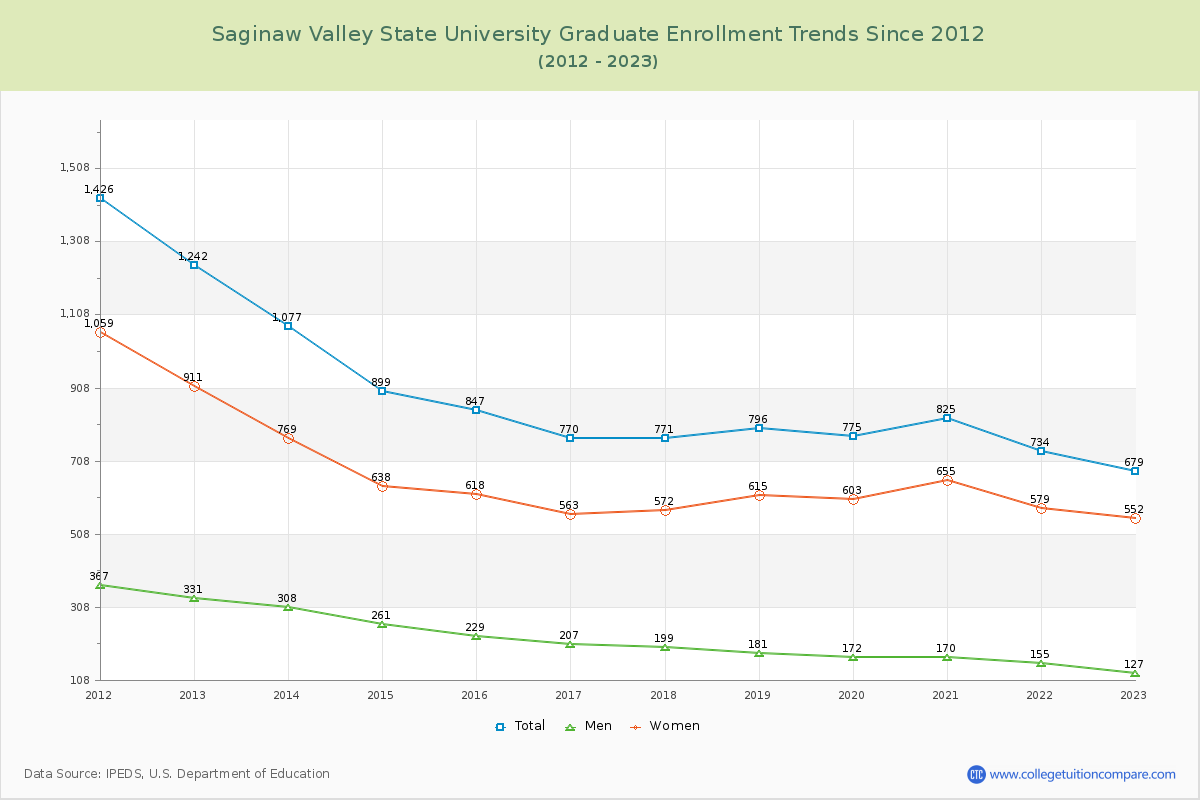
90.50% of total students is undergraduate students and 9.50% students is graduate students. The number of undergraduate students has decreased by 2,842 and the graduate enrollment has decreased by 563 over past 10 years.
The female to male ratio is 1.91 to 1 and it means that there are more female students enrolled in Saginaw Valley State than male students.
The following table and chart illustrate the changes in student population by gender at Saginaw Valley State University since 2012.
| Year | Total | Undergraduate | Graduate | ||||
|---|---|---|---|---|---|---|---|
| Total | Men | Women | Total | Men | Women | ||
| 2012-13 | 10,552 | 9,310 | 4,015 | 5,295 | 1,242 | 331 | 911 |
| 2013-14 | 10,245 -307 | 9,168 -142 | 3,935 -80 | 5,233 -62 | 1,077 -165 | 308 -23 | 769 -142 |
| 2014-15 | 9,829 -416 | 8,930 -238 | 3,764 -171 | 5,166 -67 | 899 -178 | 261 -47 | 638 -131 |
| 2015-16 | 9,633 -196 | 8,786 -144 | 3,751 -13 | 5,035 -131 | 847 -52 | 229 -32 | 618 -20 |
| 2016-17 | 9,105 -528 | 8,335 -451 | 3,503 -248 | 4,832 -203 | 770 -77 | 207 -22 | 563 -55 |
| 2017-18 | 8,617 -488 | 7,846 -489 | 3,203 -300 | 4,643 -189 | 771 1 | 199 -8 | 572 9 |
| 2018-19 | 8,515 -102 | 7,719 -127 | 3,086 -117 | 4,633 -10 | 796 25 | 181 -18 | 615 43 |
| 2019-20 | 8,251 -264 | 7,476 -243 | 2,877 -209 | 4,599 -34 | 775 -21 | 172 -9 | 603 -12 |
| 2020-21 | 8,028 -223 | 7,203 -273 | 2,619 -258 | 4,584 -15 | 825 50 | 170 -2 | 655 52 |
| 2021-22 | 7,523 -505 | 6,789 -414 | 2,415 -204 | 4,374 -210 | 734 -91 | 155 -15 | 579 -76 |
| 2022-23 | 7,147 -376 | 6,468 -321 | 2,327 -88 | 4,141 -233 | 679 -55 | 127 -28 | 552 -27 |
| Average | 8,859 | 8,003 | 3,227 | 4,776 | 856 | 213 | 643 |