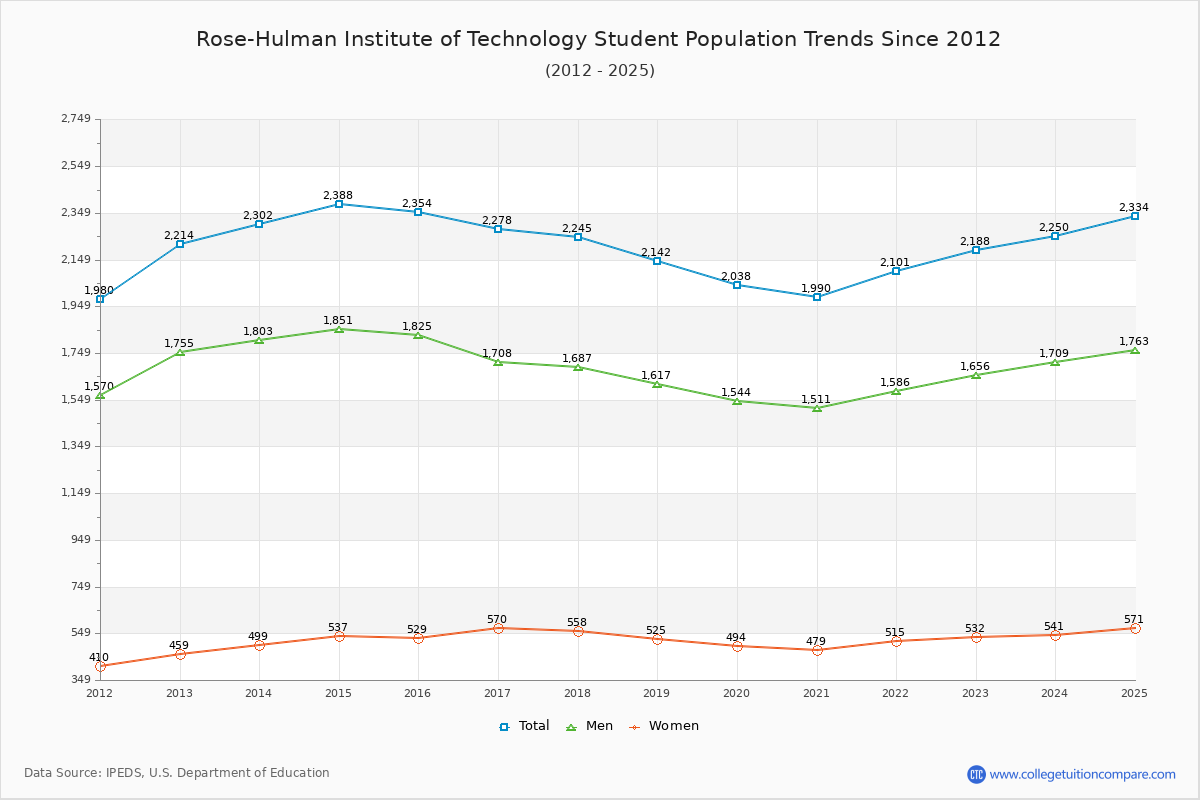
Student Population Changes
The average student population over the last 12 years is 2,204 where 2,188 students are attending the school for the academic year 2022-2023.
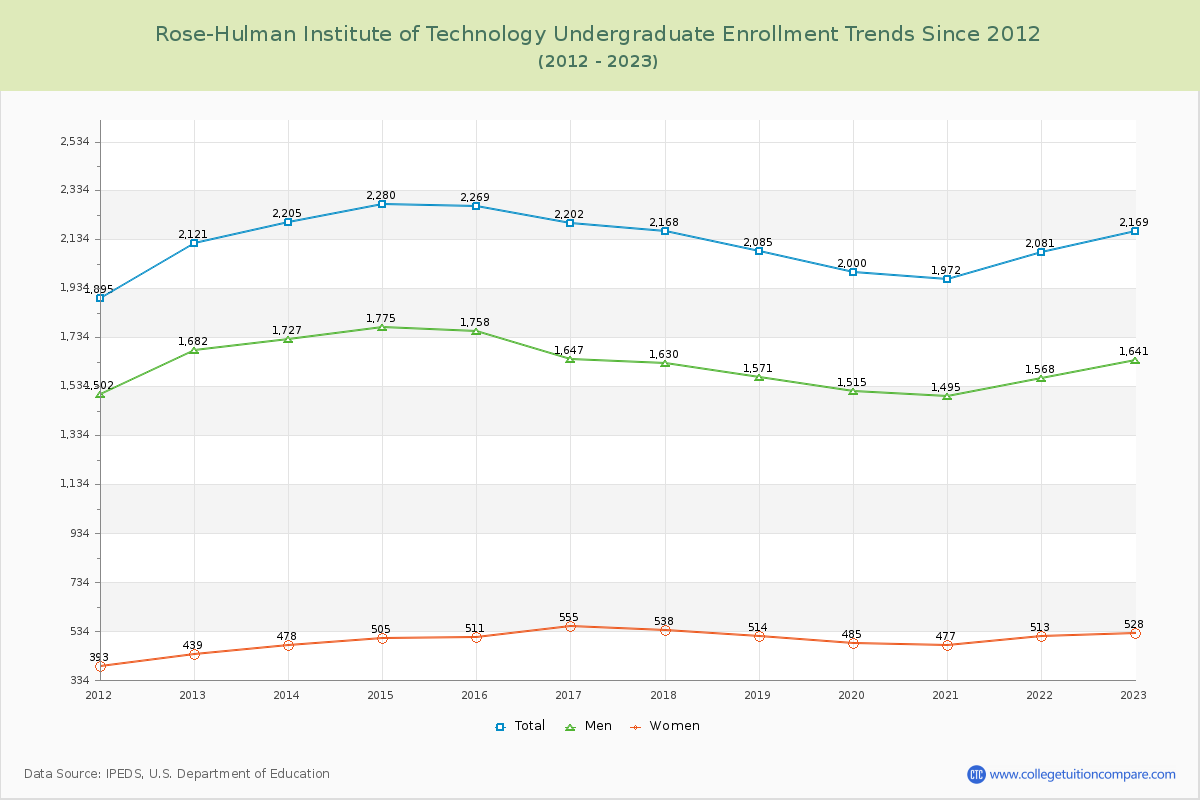
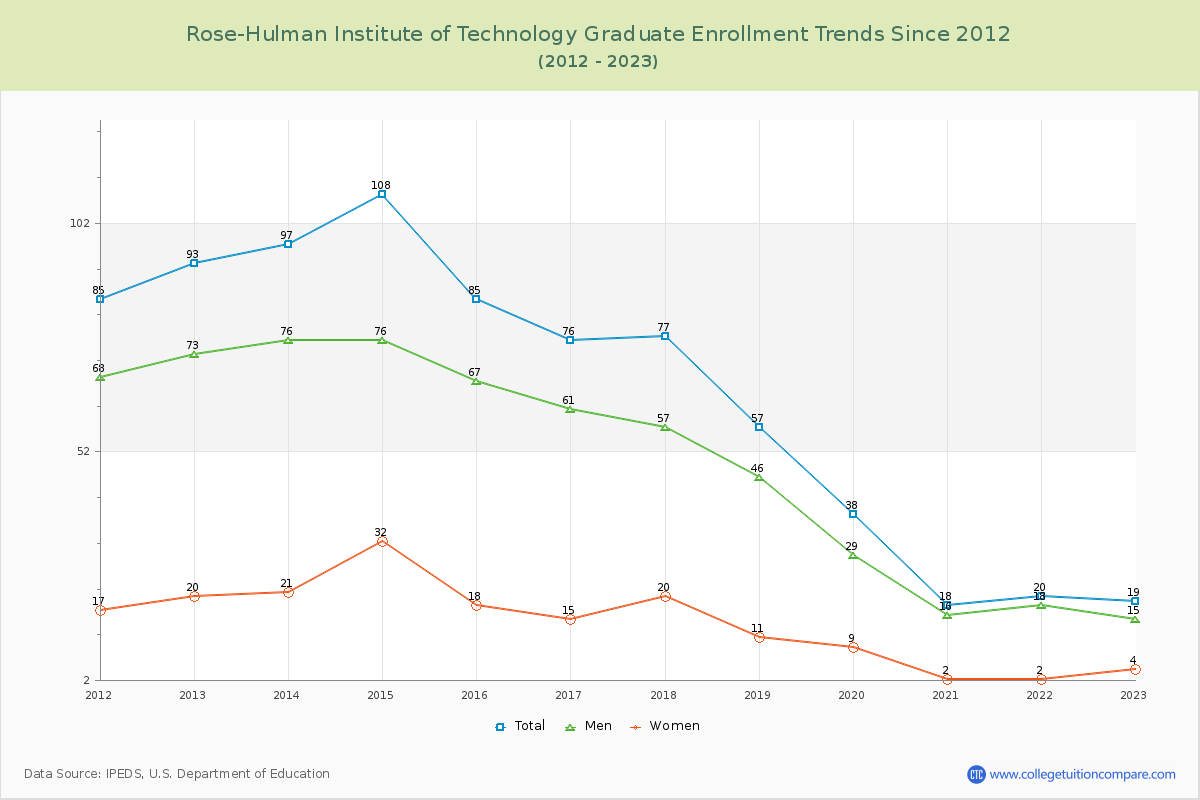
99.13% of total students is undergraduate students and 0.87% students is graduate students. The number of undergraduate students has increased by 48 and the graduate enrollment has decreased by 74 over past 10 years.
The female to male ratio is 0.32 to 1 and it means that there are far more male students enrolled in RHIT than female students.
The following table and chart illustrate the changes in student population by gender at Rose-Hulman Institute of Technology since 2012.
| Year | Total | Undergraduate | Graduate | ||||
|---|---|---|---|---|---|---|---|
| Total | Men | Women | Total | Men | Women | ||
| 2012-13 | 2,214 | 2,121 | 1,682 | 439 | 93 | 73 | 20 |
| 2013-14 | 2,302 88 | 2,205 84 | 1,727 45 | 478 39 | 97 4 | 76 3 | 21 1 |
| 2014-15 | 2,388 86 | 2,280 75 | 1,775 48 | 505 27 | 108 11 | 76 0 | 32 11 |
| 2015-16 | 2,354 -34 | 2,269 -11 | 1,758 -17 | 511 6 | 85 -23 | 67 -9 | 18 -14 |
| 2016-17 | 2,278 -76 | 2,202 -67 | 1,647 -111 | 555 44 | 76 -9 | 61 -6 | 15 -3 |
| 2017-18 | 2,245 -33 | 2,168 -34 | 1,630 -17 | 538 -17 | 77 1 | 57 -4 | 20 5 |
| 2018-19 | 2,142 -103 | 2,085 -83 | 1,571 -59 | 514 -24 | 57 -20 | 46 -11 | 11 -9 |
| 2019-20 | 2,038 -104 | 2,000 -85 | 1,515 -56 | 485 -29 | 38 -19 | 29 -17 | 9 -2 |
| 2020-21 | 1,990 -48 | 1,972 -28 | 1,495 -20 | 477 -8 | 18 -20 | 16 -13 | 2 -7 |
| 2021-22 | 2,101 111 | 2,081 109 | 1,568 73 | 513 36 | 20 2 | 18 2 | 2 0 |
| 2022-23 | 2,188 87 | 2,169 88 | 1,641 73 | 528 15 | 19 -1 | 15 -3 | 4 2 |
| Average | 2,204 | 2,141 | 1,637 | 504 | 63 | 49 | 14 |