Applicants, Acceptance Rate, Yield Trends at RHIT

40.78%

Applicants - since 2015

19.06%

Acceptance Rate

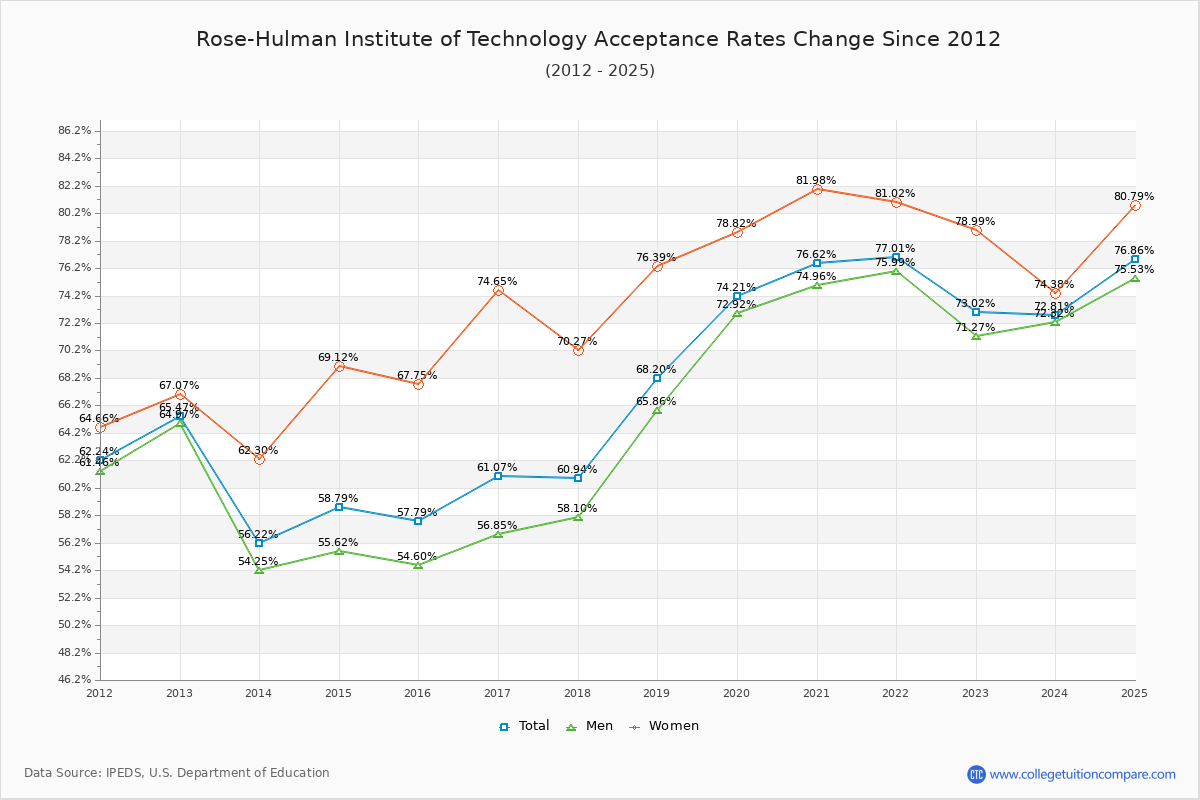
The average acceptance rate at RHIT over the past 10 years is 69.85%, and the most recent acceptance rate is 76.86%. Compared to the previous year, it became easier to gain admission to RHIT in 2025.

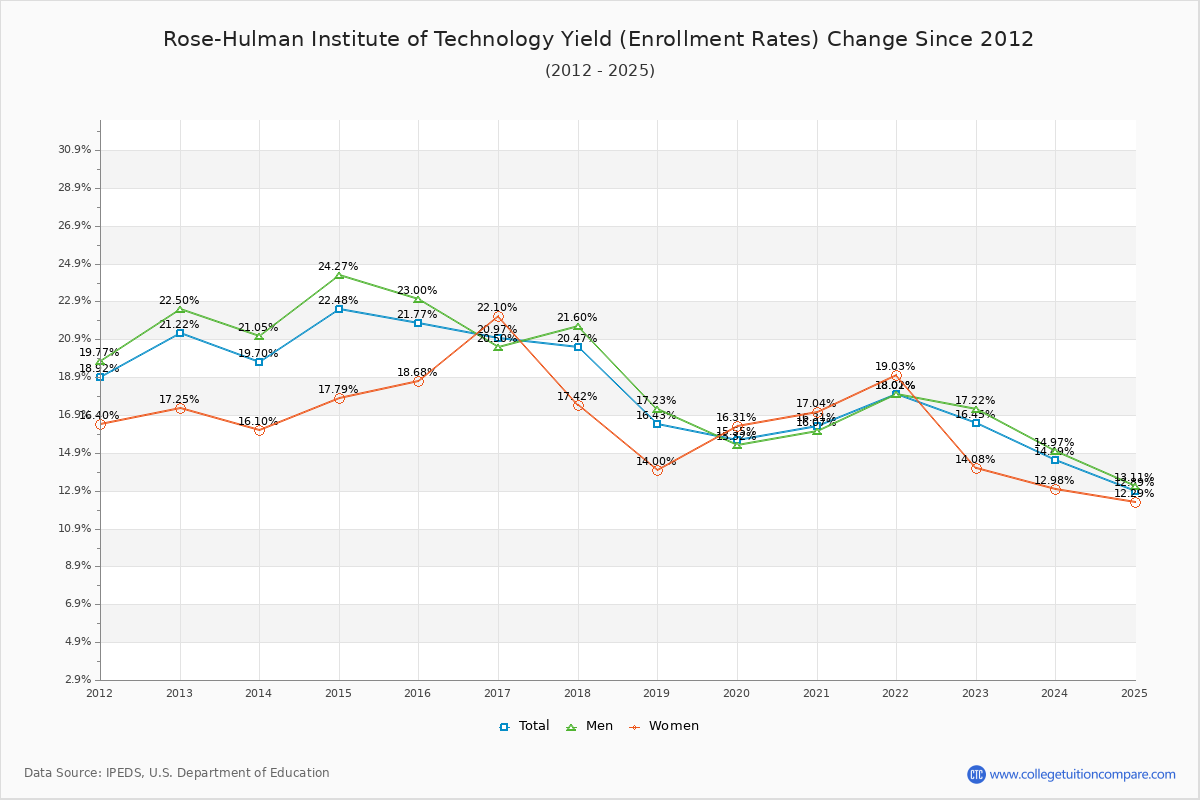
The average yield (enrollment rate) over the period is 17.33%, and the 2025 yield is 12.89%. Overall, the yield has decreased by 40.80% from 2015 to 2025.

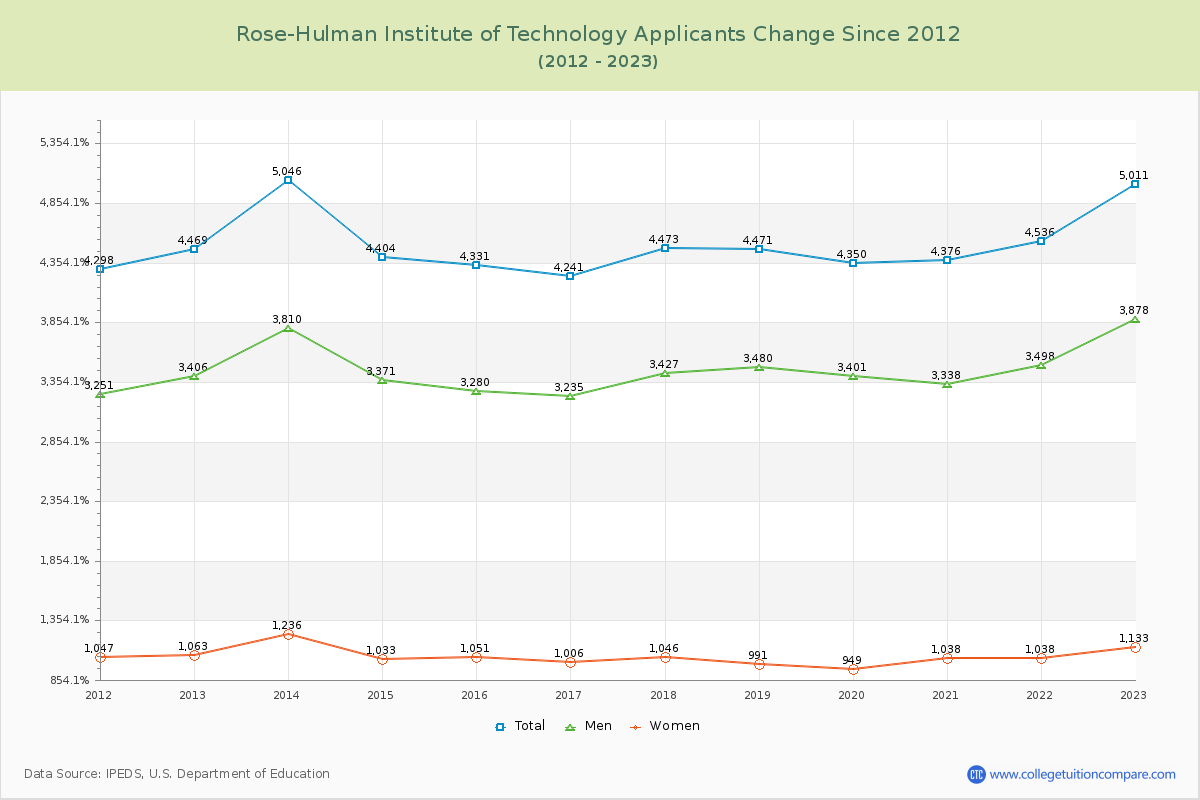
The number of RHIT applicants increased by 13.24% (713 applicants) compared to the previous year. Over the entire 10-year period, applicants increased by 40.78% overall.

Key Takeaways: RHIT Admission Metrics

Acceptance Rate Overview

The current acceptance rate for the 2025 admission cycle is 76.86%, showing a decreasing selectivity trend. This suggests that RHIT is admitting a higher proportion of applicants, which may indicate either an increase in application quality or a strategic enrollment decision by the institution.

Yield Rate & Enrollment Patterns

The admission yield (the percentage of admitted students who enroll) for the 2025 academic year is 12.89%. The declining yield trend suggests that a lower percentage of admitted students are choosing to enroll at RHIT. This pattern may reflect increased competition from peer institutions, changing student demographics, or shifts in institutional enrollment strategy.

Application Volume & Admission Trends

For the 2025 admission cycle, RHIT received approximately 6,097 applications, admitted 4,686 students, and enrolled 604 students. The rising application volume trend indicates that RHIT is attracting an increasing number of prospective students over time. This growth in applications typically reflects enhanced institutional visibility, improved marketing initiatives, or increasing perceived value in the higher education market.

Acceptance Rate Changes

RHIT 10-Year Admission Rate Summary: The acceptance rate trends at RHIT over the past decade show a relatively stable trend, with fluctuations in both directions. The average acceptance rate over this period is 69.85%, while the most recent rate stands at 76.86%. This data reflects the institution's evolving competitiveness in the higher education admissions landscape.

For the most recent admission cycle (2025), the acceptance rate is 76.86%. By gender, the average acceptance rate for men is 67.84% and for women is 76.50%.

The following table and chart show how acceptance rates at RHIT have changed over the past 10 years (2015-2025).

YearTotalMenWomen
2015-16 57.79% 54.60% 67.75%
2016-17 61.07%
3.28%
56.85%
2.24%
74.65%
6.91%
2017-18 60.94%
-0.13%
58.10%
1.25%
70.27%
-4.38%
2018-19 68.20%
7.25%
65.86%
7.76%
76.39%
6.12%
2019-20 74.21%
6.01%
72.92%
7.06%
78.82%
2.43%
2020-21 76.62%
2.42%
74.96%
2.04%
81.98%
3.16%
2021-22 77.01%
0.38%
75.99%
1.03%
81.02%
-0.96%
2022-23 73.02%
-3.99%
71.27%
-4.71%
78.99%
-2.03%
2023-24 72.81%
-0.21%
72.32%
1.04%
74.38%
-4.62%
2024-25 76.86%
4.05%
75.53%
3.22%
80.79%
6.41%
Average 69.85% 67.84% 76.50%
Rose-Hulman Institute of Technology Acceptance Rate Trends Over Time - Historical Admission Rate Data Visualization Chart

Admission Yield (Enrollment Rate) Changes

RHIT has demonstrated a decline in admission yield over the past 10 years. The institution's yield rate has decreased from 21.77% in 2015 to 12.89% in 2025, representing a 40.80% decrease. The 10-year average yield stands at 17.33%, reflecting weakening enrollment performance.

The following table and chart illustrate the changes in yield at RHIT from 2015 to 2025. The admission yield has decreased by 40.80% over this period.

YearTotalMenWomen
2015-16 21.77% 23.00% 18.68%
2016-17 20.97%
-0.81%
20.50%
-2.50%
22.10%
3.42%
2017-18 20.47%
-0.50%
21.60%
1.10%
17.42%
-4.69%
2018-19 16.43%
-4.04%
17.23%
-4.36%
14.00%
-3.41%
2019-20 15.55%
-0.88%
15.32%
-1.91%
16.31%
2.31%
2020-21 16.31%
0.76%
16.07%
0.74%
17.04%
0.73%
2021-22 18.01%
1.69%
18.02%
1.95%
19.03%
1.99%
2022-23 16.45%
-1.55%
17.22%
-0.80%
14.08%
-4.95%
2023-24 14.49%
-1.96%
14.97%
-2.25%
12.98%
-1.09%
2024-25 12.89%
-1.60%
13.11%
-1.86%
12.29%
-0.70%
Average 17.33% 17.71% 16.39%
Rose-Hulman Institute of Technology enrollment rate trends chart showing historical yield changes from 2015 to 2025

Applicants, Admitted, and Enrolled Headcount Changes

Over the past 10 years, The average number of applicants is 4,727, the average number of admitted is 3,321, and the average number of first-year enrolled students is 560.

The number of RHIT applicants increased by 13.24% (713 applicants) compared to the previous year. Over the entire 10-year period, applicants increased by 40.78% overall.

The following table and chart show the changes of applicants, admitted, and enrolled headcount at Rose-Hulman Institute of Technology from 2015 to 2025.

YearApplicantsAdmittedEnrolled
2015-16 4,331 2,503 545
2016-17 4,241
-2.08%
2,590
3.48%
543
-0.37%
2017-18 4,473
5.47%
2,726
5.25%
558
2.76%
2018-19 4,471
-0.04%
3,049
11.85%
501
-10.22%
2019-20 4,350
-2.71%
3,228
5.87%
502
0.20%
2020-21 4,376
0.60%
3,353
3.87%
547
8.96%
2021-22 4,536
3.66%
3,493
4.18%
629
14.99%
2022-23 5,011
10.47%
3,659
4.75%
602
-4.29%
2023-24 5,384
7.44%
3,920
7.13%
568
-5.65%
2024-25 6,097
13.24%
4,686
19.54%
604
6.34%
Average 4,727 3,321 560
Rose-Hulman Institute of Technology - 10 Year Applicants, Admissions, and Enrollment Trends Chart

Compare Acceptance Rate Change to Similar Colleges

The following table compares Rose-Hulman Institute of Technology' acceptance rate to similar schools.

20242025Change %
Rose-Hulman Institute of Technology72.81%76.86%5.56%
Indiana Wesleyan University-National & Global---
University of Notre Dame11.27%12.38%-8.97%
Trine University-Regional/Non-Traditional Campuses39.86%21.62%84.37%
Butler University85.08%85.87%-0.92%
University of Indianapolis66.50%72.76%-8.60%

Ratings & Review

Share your experiences and thoughts about Rose-Hulman Institute of Technology. It will be a great help to applicants and prospective students!