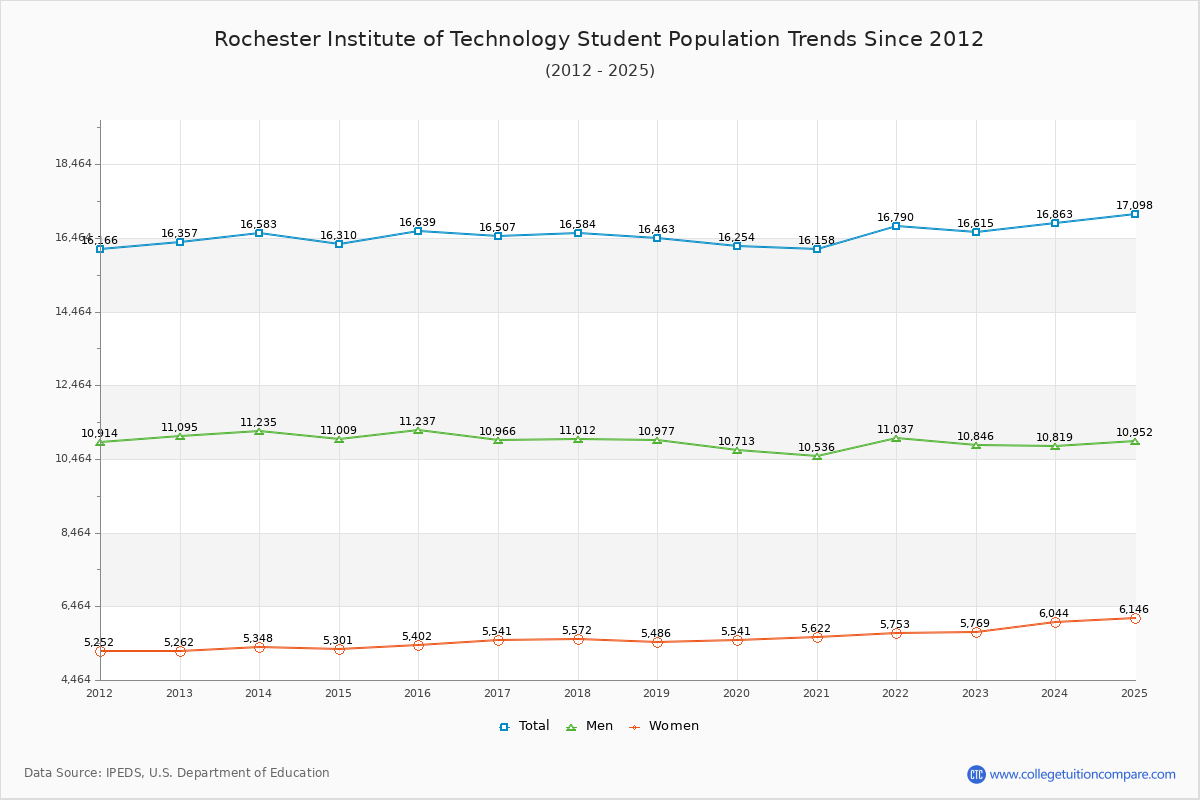
Student Population Changes
The average student population over the last 12 years is 16,478 where 16,615 students are attending the school for the academic year 2022-2023.
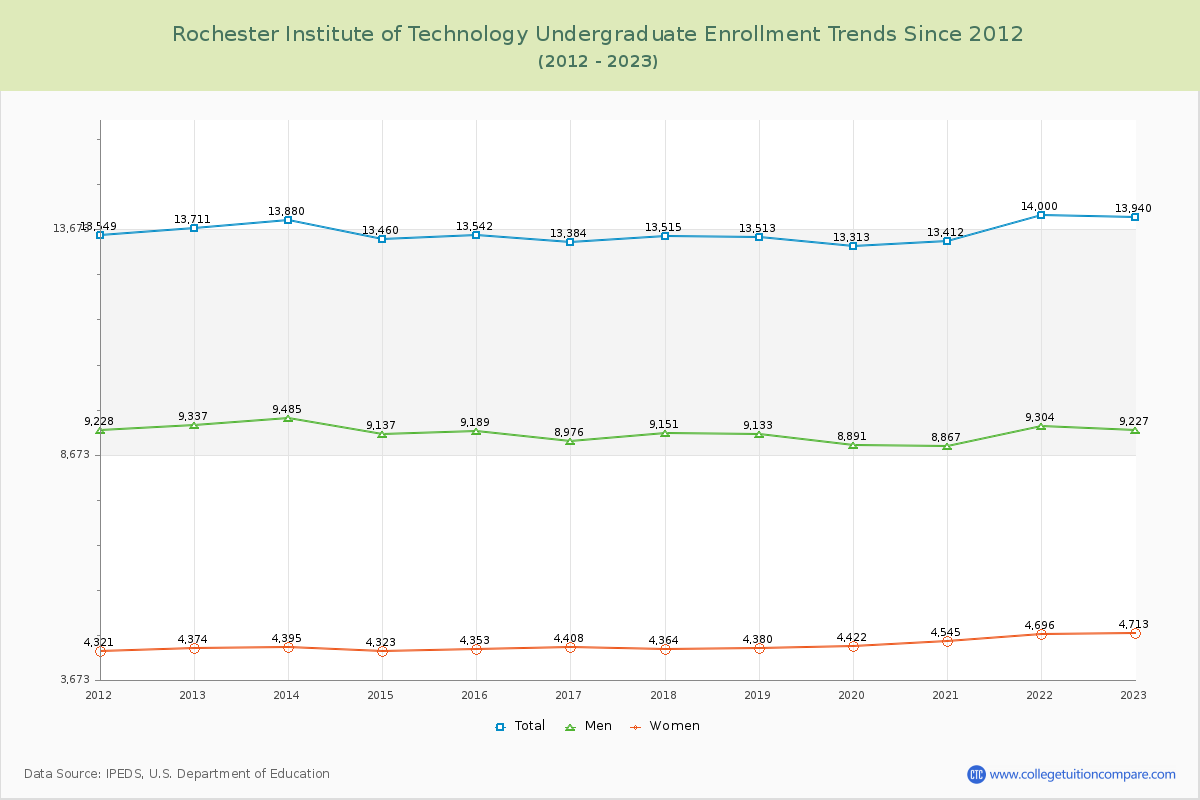
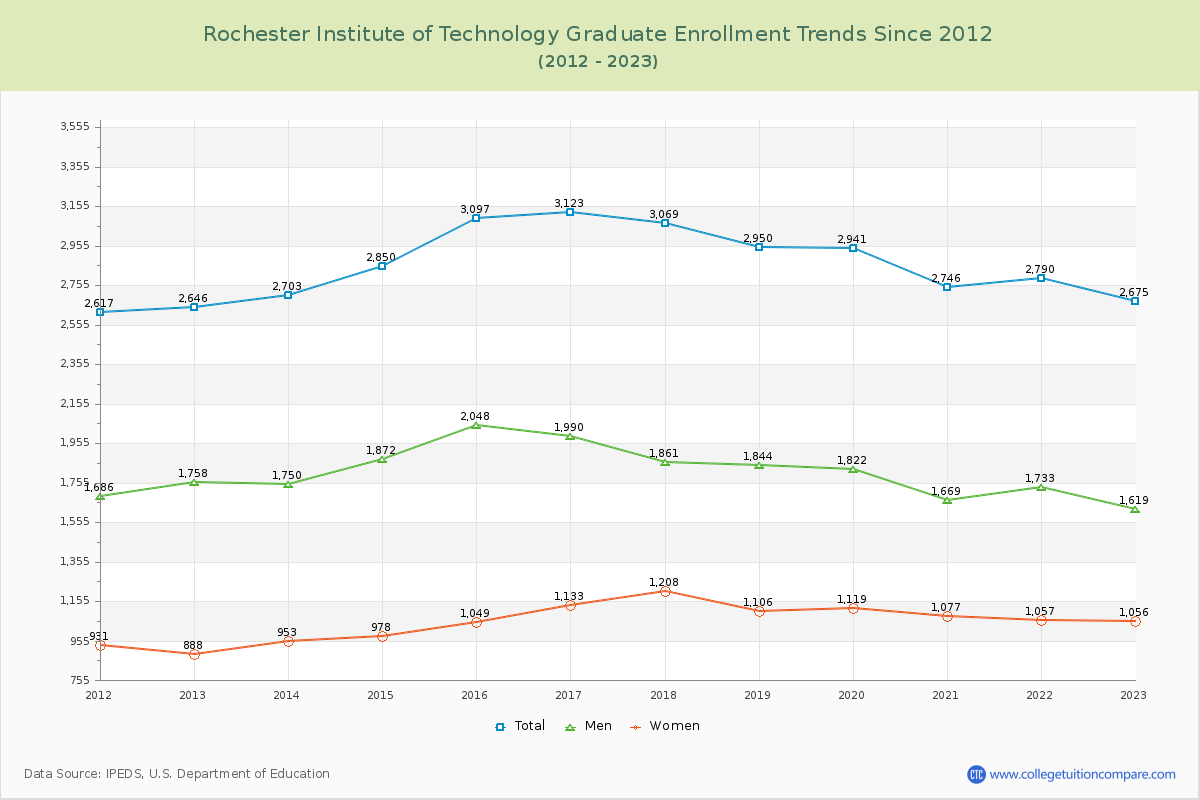
83.90% of total students is undergraduate students and 16.10% students is graduate students. The number of undergraduate students has increased by 229 and the graduate enrollment has increased by 29 over past 10 years.
The female to male ratio is 0.53 to 1 and it means that there are more male students enrolled in RIT than female students.
The following table and chart illustrate the changes in student population by gender at Rochester Institute of Technology since 2012.
| Year | Total | Undergraduate | Graduate | ||||
|---|---|---|---|---|---|---|---|
| Total | Men | Women | Total | Men | Women | ||
| 2012-13 | 16,357 | 13,711 | 9,337 | 4,374 | 2,646 | 1,758 | 888 |
| 2013-14 | 16,583 226 | 13,880 169 | 9,485 148 | 4,395 21 | 2,703 57 | 1,750 -8 | 953 65 |
| 2014-15 | 16,310 -273 | 13,460 -420 | 9,137 -348 | 4,323 -72 | 2,850 147 | 1,872 122 | 978 25 |
| 2015-16 | 16,639 329 | 13,542 82 | 9,189 52 | 4,353 30 | 3,097 247 | 2,048 176 | 1,049 71 |
| 2016-17 | 16,507 -132 | 13,384 -158 | 8,976 -213 | 4,408 55 | 3,123 26 | 1,990 -58 | 1,133 84 |
| 2017-18 | 16,584 77 | 13,515 131 | 9,151 175 | 4,364 -44 | 3,069 -54 | 1,861 -129 | 1,208 75 |
| 2018-19 | 16,463 -121 | 13,513 -2 | 9,133 -18 | 4,380 16 | 2,950 -119 | 1,844 -17 | 1,106 -102 |
| 2019-20 | 16,254 -209 | 13,313 -200 | 8,891 -242 | 4,422 42 | 2,941 -9 | 1,822 -22 | 1,119 13 |
| 2020-21 | 16,158 -96 | 13,412 99 | 8,867 -24 | 4,545 123 | 2,746 -195 | 1,669 -153 | 1,077 -42 |
| 2021-22 | 16,790 632 | 14,000 588 | 9,304 437 | 4,696 151 | 2,790 44 | 1,733 64 | 1,057 -20 |
| 2022-23 | 16,615 -175 | 13,940 -60 | 9,227 -77 | 4,713 17 | 2,675 -115 | 1,619 -114 | 1,056 -1 |
| Average | 16,478 | 13,606 | 9,154 | 4,452 | 2,872 | 1,815 | 1,057 |