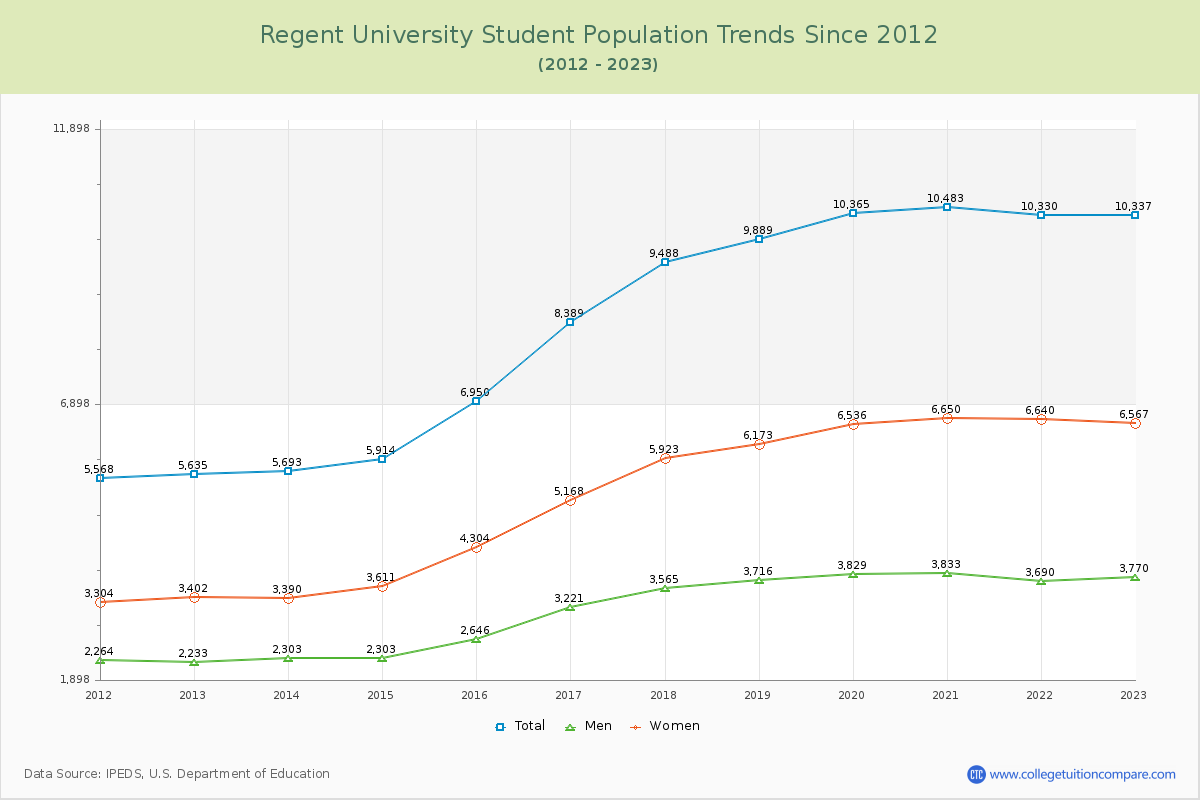
Student Population Changes
The average student population over the last 12 years is 8,498 where 10,337 students are attending the school for the academic year 2022-2023.
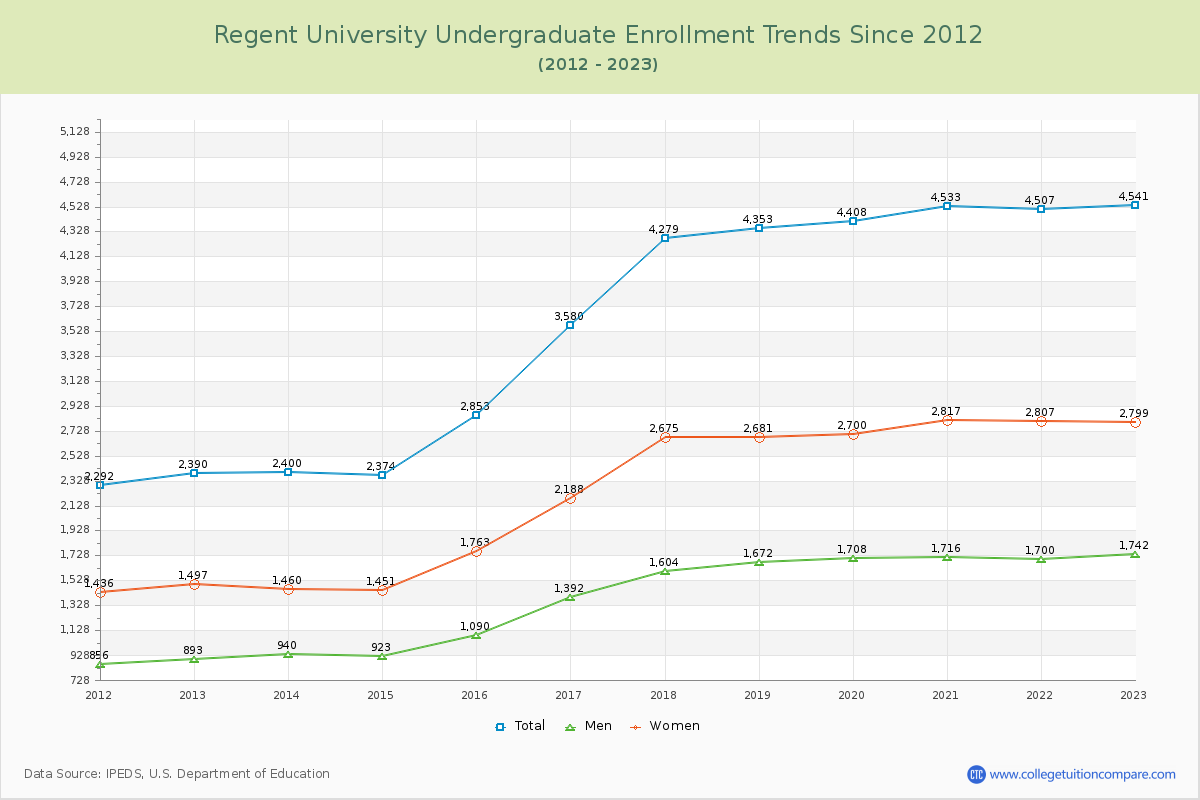
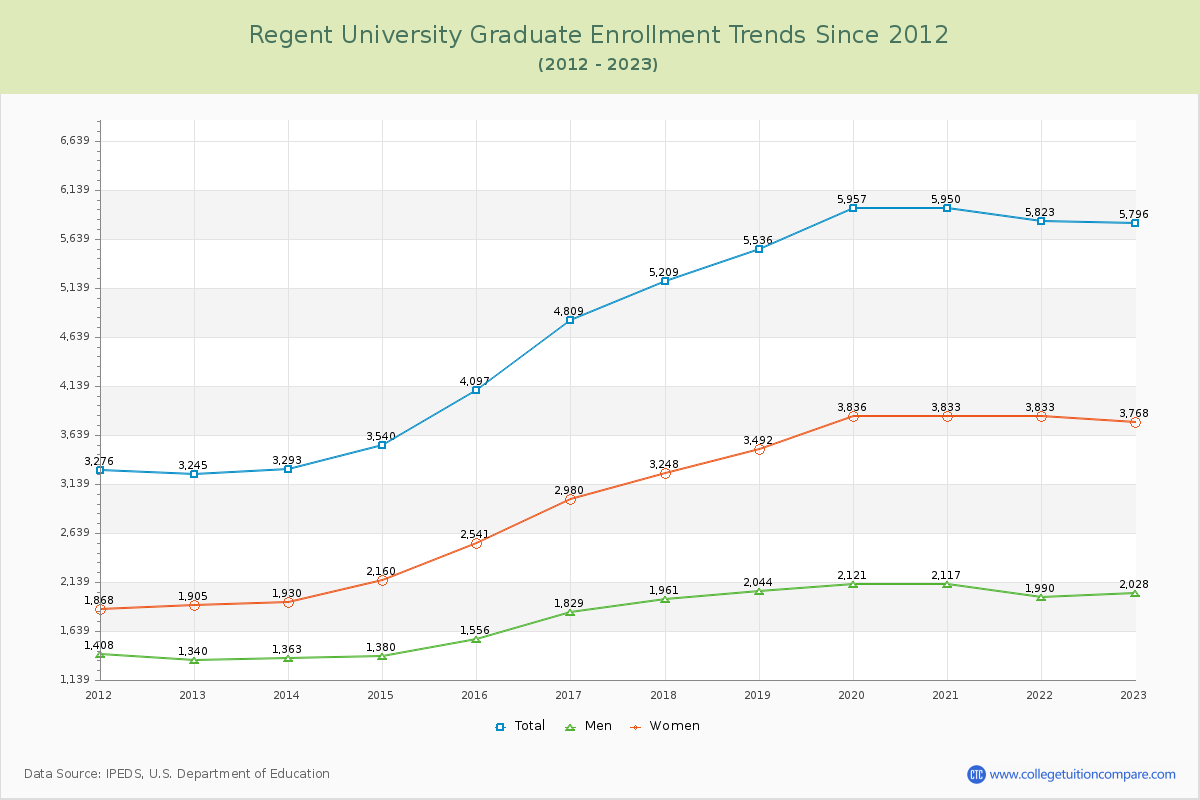
43.93% of total students is undergraduate students and 56.07% students is graduate students. The number of undergraduate students has increased by 2,151 and the graduate enrollment has increased by 2,551 over past 10 years.
The female to male ratio is 1.74 to 1 and it means that there are more female students enrolled in Regent than male students.
The following table and chart illustrate the changes in student population by gender at Regent University since 2012.
| Year | Total | Undergraduate | Graduate | ||||
|---|---|---|---|---|---|---|---|
| Total | Men | Women | Total | Men | Women | ||
| 2012-13 | 5,635 | 2,390 | 893 | 1,497 | 3,245 | 1,340 | 1,905 |
| 2013-14 | 5,693 58 | 2,400 10 | 940 47 | 1,460 -37 | 3,293 48 | 1,363 23 | 1,930 25 |
| 2014-15 | 5,914 221 | 2,374 -26 | 923 -17 | 1,451 -9 | 3,540 247 | 1,380 17 | 2,160 230 |
| 2015-16 | 6,950 1,036 | 2,853 479 | 1,090 167 | 1,763 312 | 4,097 557 | 1,556 176 | 2,541 381 |
| 2016-17 | 8,389 1,439 | 3,580 727 | 1,392 302 | 2,188 425 | 4,809 712 | 1,829 273 | 2,980 439 |
| 2017-18 | 9,488 1,099 | 4,279 699 | 1,604 212 | 2,675 487 | 5,209 400 | 1,961 132 | 3,248 268 |
| 2018-19 | 9,889 401 | 4,353 74 | 1,672 68 | 2,681 6 | 5,536 327 | 2,044 83 | 3,492 244 |
| 2019-20 | 10,365 476 | 4,408 55 | 1,708 36 | 2,700 19 | 5,957 421 | 2,121 77 | 3,836 344 |
| 2020-21 | 10,483 118 | 4,533 125 | 1,716 8 | 2,817 117 | 5,950 -7 | 2,117 -4 | 3,833 -3 |
| 2021-22 | 10,330 -153 | 4,507 -26 | 1,700 -16 | 2,807 -10 | 5,823 -127 | 1,990 -127 | 3,833 0 |
| 2022-23 | 10,337 7 | 4,541 34 | 1,742 42 | 2,799 -8 | 5,796 -27 | 2,028 38 | 3,768 -65 |
| Average | 8,498 | 3,656 | 1,398 | 2,258 | 4,841 | 1,794 | 3,048 |