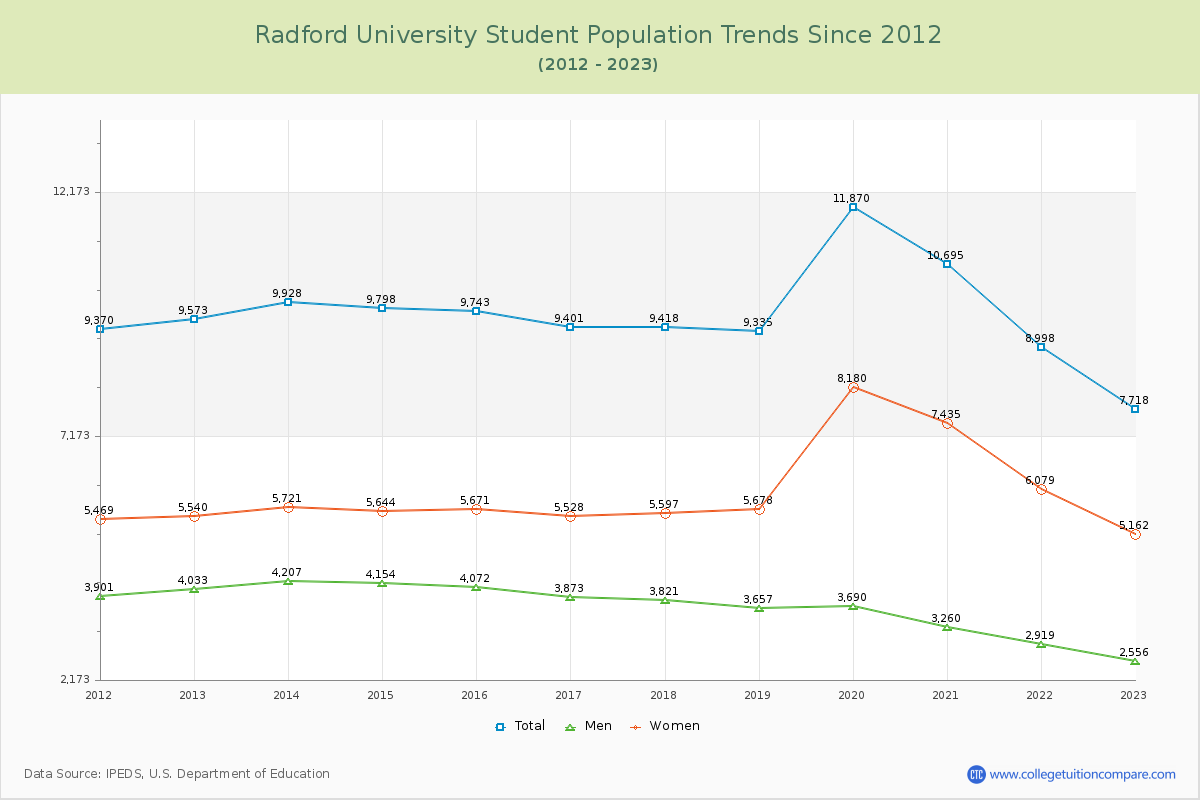
Student Population Changes
The average student population over the last 12 years is 9,680 where 7,718 students are attending the school for the academic year 2022-2023.
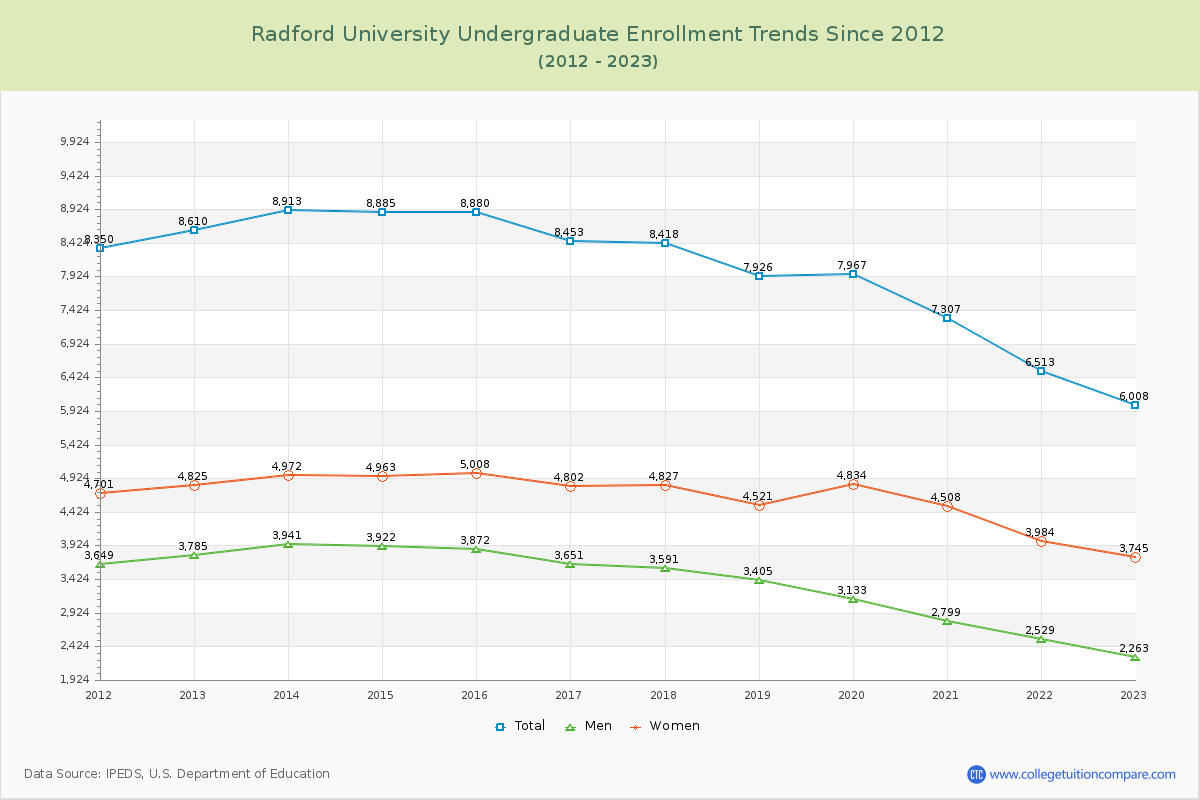
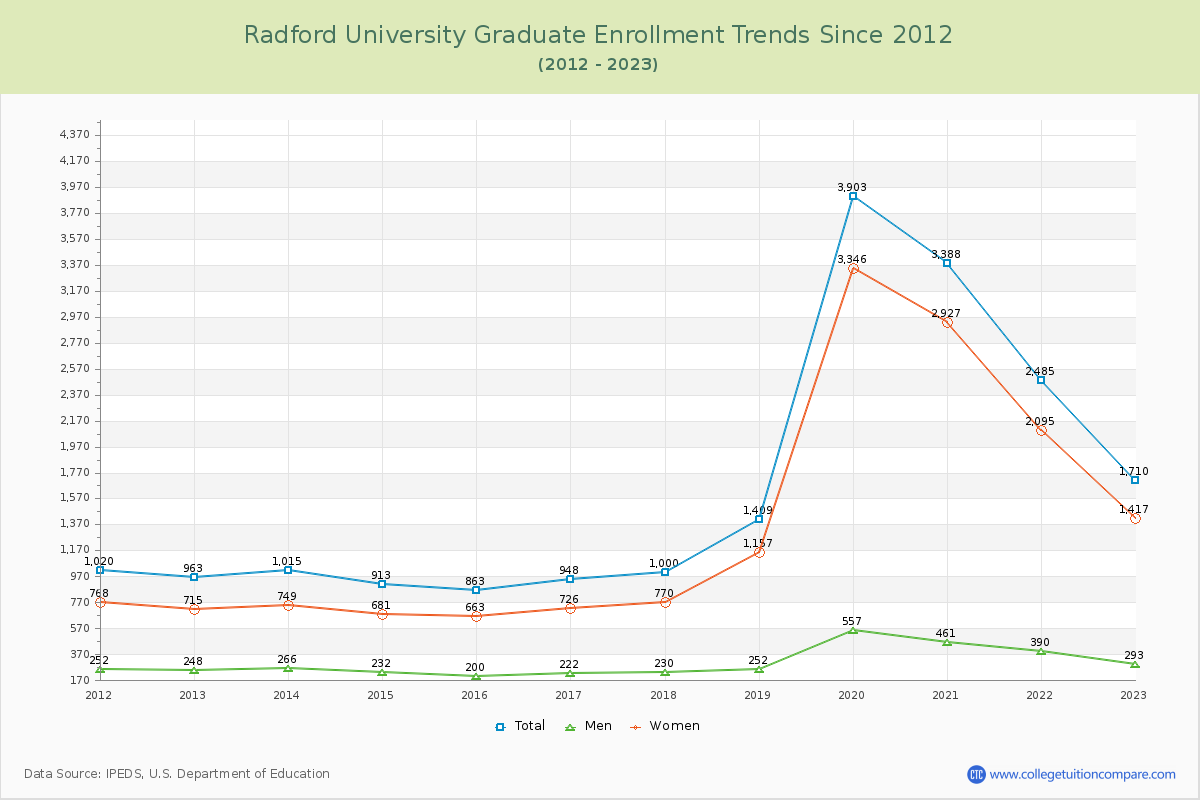
77.84% of total students is undergraduate students and 22.16% students is graduate students. The number of undergraduate students has decreased by 2,602 and the graduate enrollment has increased by 747 over past 10 years.
The female to male ratio is 2.02 to 1 and it means that there are far more female students enrolled in Radford than male students.
The following table and chart illustrate the changes in student population by gender at Radford University since 2012.
| Year | Total | Undergraduate | Graduate | ||||
|---|---|---|---|---|---|---|---|
| Total | Men | Women | Total | Men | Women | ||
| 2012-13 | 9,573 | 8,610 | 3,785 | 4,825 | 963 | 248 | 715 |
| 2013-14 | 9,928 355 | 8,913 303 | 3,941 156 | 4,972 147 | 1,015 52 | 266 18 | 749 34 |
| 2014-15 | 9,798 -130 | 8,885 -28 | 3,922 -19 | 4,963 -9 | 913 -102 | 232 -34 | 681 -68 |
| 2015-16 | 9,743 -55 | 8,880 -5 | 3,872 -50 | 5,008 45 | 863 -50 | 200 -32 | 663 -18 |
| 2016-17 | 9,401 -342 | 8,453 -427 | 3,651 -221 | 4,802 -206 | 948 85 | 222 22 | 726 63 |
| 2017-18 | 9,418 17 | 8,418 -35 | 3,591 -60 | 4,827 25 | 1,000 52 | 230 8 | 770 44 |
| 2018-19 | 9,335 -83 | 7,926 -492 | 3,405 -186 | 4,521 -306 | 1,409 409 | 252 22 | 1,157 387 |
| 2019-20 | 11,870 2,535 | 7,967 41 | 3,133 -272 | 4,834 313 | 3,903 2,494 | 557 305 | 3,346 2,189 |
| 2020-21 | 10,695 -1,175 | 7,307 -660 | 2,799 -334 | 4,508 -326 | 3,388 -515 | 461 -96 | 2,927 -419 |
| 2021-22 | 8,998 -1,697 | 6,513 -794 | 2,529 -270 | 3,984 -524 | 2,485 -903 | 390 -71 | 2,095 -832 |
| 2022-23 | 7,718 -1,280 | 6,008 -505 | 2,263 -266 | 3,745 -239 | 1,710 -775 | 293 -97 | 1,417 -678 |
| Average | 9,680 | 7,989 | 3,354 | 4,635 | 1,691 | 305 | 1,386 |