Student Population by Gender
Radford University has a total of 7,718 enrolled students for the academic year 2022-2023. 6,008 students have enrolled in undergraduate programs and 1,710 students joined graduate programs.
By gender, 2,556 male and 5,162 female students (the male-female ratio is 33:67) are attending the school. The gender distribution is based on the 2022-2023 data.
| Total | Undergraduate | Graduate | |
|---|---|---|---|
| Total | 7,718 | 6,008 | 1,710 |
| Men | 2,556 | 2,263 | 293 |
| Women | 5,162 | 3,745 | 1,417 |
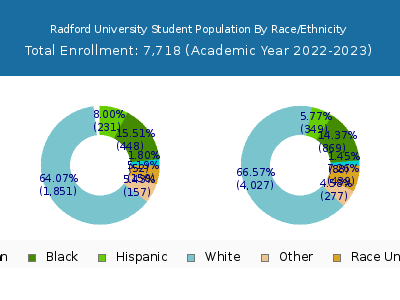
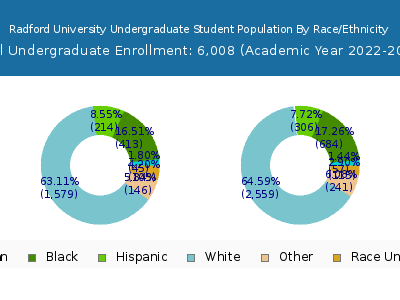
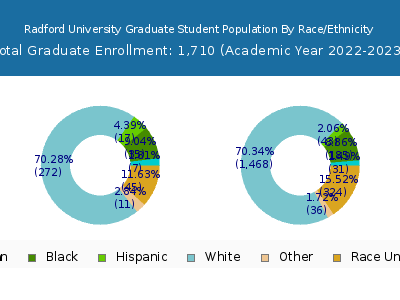
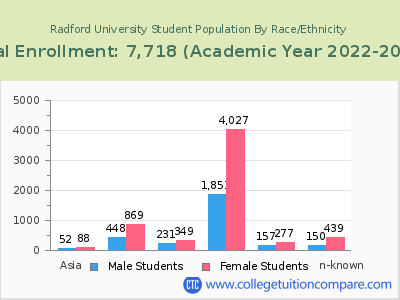
Student Distribution by Race/Ethnicity
| Race | Total | Men | Women |
|---|---|---|---|
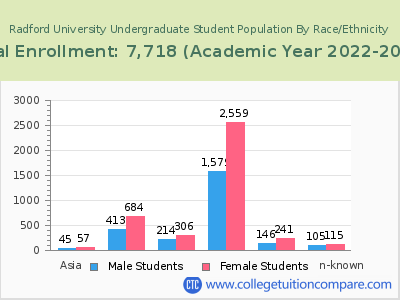
| American Indian or Native American | 21 | 4 | 17 |
| Asian | 128 | 37 | 91 |
| Black | 1,057 | 366 | 691 |
| Hispanic | 603 | 224 | 379 |
| Native Hawaiian or Other Pacific Islanders | 7 | 2 | 5 |
| White | 5,126 | 1,671 | 3,455 |
| Two or more races | 374 | 118 | 256 |
| Race Unknown | 337 | 103 | 234 |
| Race | Total | Men | Women |
|---|---|---|---|
| American Indian or Native American | 19 | 4 | 15 |
| Asian | 91 | 30 | 61 |
| Black | 900 | 333 | 567 |
| Hispanic | 542 | 209 | 333 |
| Native Hawaiian or Other Pacific Islanders | 6 | 2 | 4 |
| White | 3,891 | 1,470 | 2,421 |
| Two or more races | 326 | 107 | 219 |
| Race Unknown | 185 | 82 | 103 |
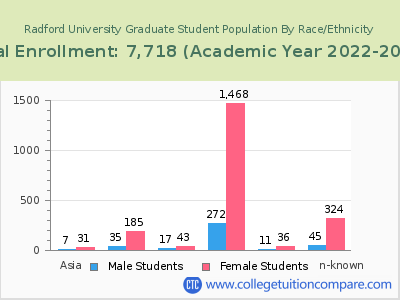
| Race | Total | Men | Women |
|---|---|---|---|
| American Indian or Native American | 0 | 0 | 0 |
| Asian | 13 | 3 | 10 |
| Black | 54 | 21 | 33 |
| Hispanic | 53 | 19 | 34 |
| Native Hawaiian or Other Pacific Islanders | 3 | 1 | 2 |
| White | 387 | 146 | 241 |
| Two or more races | 27 | 8 | 19 |
| Race Unknown | 18 | 9 | 9 |
Student Age Distribution
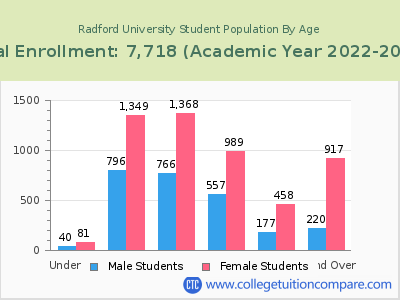
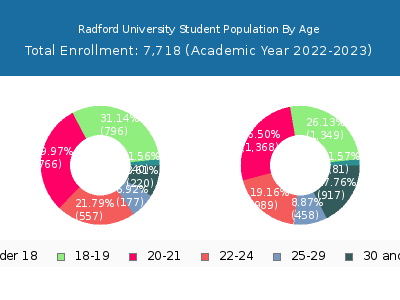
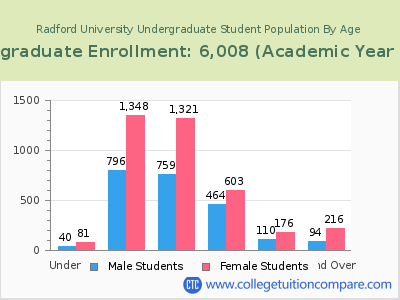
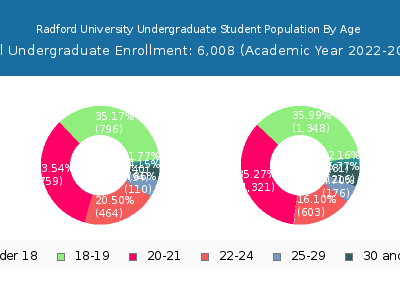
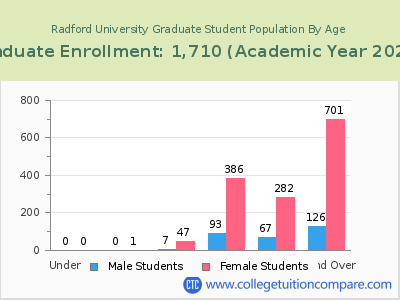
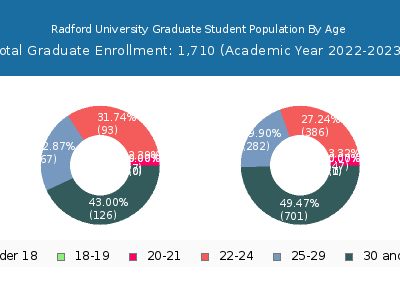
By age, Radford has 121 students under 18 years old and 9 students over 65 years old. There are 5,946 students under 25 years old, and 1,772 students over 25 years old out of 7,718 total students.
In undergraduate programs, 121 students are younger than 18 and 2 students are older than 65. Radford has 5,412 undergraduate students aged under 25 and 596 students aged 25 and over.
It has 534 graduate students aged under 25 and 1,176 students aged 25 and over.
| Age | Total | Men | Women |
|---|---|---|---|
| Under 18 | 121 | 81 | 40 |
| 18-19 | 2,145 | 1,349 | 796 |
| 20-21 | 2,134 | 1,368 | 766 |
| 22-24 | 1,546 | 989 | 557 |
| 25-29 | 635 | 458 | 177 |
| 30-34 | 349 | 253 | 96 |
| 35-39 | 225 | 178 | 47 |
| 40-49 | 351 | 298 | 53 |
| 50-64 | 203 | 181 | 22 |
| Over 65 | 9 | 7 | 2 |
| Age | Total | Men | Women |
|---|---|---|---|
| Under 18 | 121 | 81 | 40 |
| 18-19 | 2,144 | 1,348 | 796 |
| 20-21 | 2,080 | 1,321 | 759 |
| 22-24 | 1,067 | 603 | 464 |
| 25-29 | 286 | 176 | 110 |
| 30-34 | 143 | 87 | 56 |
| 35-39 | 75 | 62 | 13 |
| 40-49 | 70 | 51 | 19 |
| 50-64 | 20 | 14 | 6 |
| Over 65 | 2 | 2 | 0 |
| Age | Total | Men | Women |
|---|
Online Student Enrollment
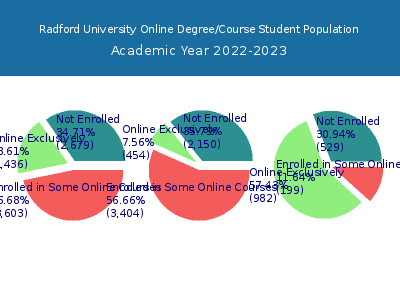
Distance learning, also called online education, is very attractive to students, especially who want to continue education and work in field. At Radford University, 1,436 students are enrolled exclusively in online courses and 3,603 students are enrolled in some online courses.
1,262 students lived in Virginia or jurisdiction in which the school is located are enrolled exclusively in online courses and 174 students live in other State or outside of the United States.
| All Students | Enrolled Exclusively Online Courses | Enrolled in Some Online Courses | |
|---|---|---|---|
| All Students | 7,718 | 1,436 | 3,603 |
| Undergraduate | 6,008 | 454 | 3,404 |
| Graduate | 1,710 | 982 | 199 |
| Virginia Residents | Other States in U.S. | Outside of U.S. | |
|---|---|---|---|
| All Students | 1,262 | 169 | 5 |
| Undergraduate | 428 | 26 | 0 |
| Graduate | 834 | 143 | 5 |
Transfer-in Students (Undergraduate)
Among 6,008 enrolled in undergraduate programs, 560 students have transferred-in from other institutions. The percentage of transfer-in students is 9.32%.455 students have transferred in as full-time status and 105 students transferred in as part-time status.
| Number of Students | |
|---|---|
| Regular Full-time | 5,033 |
| Transfer-in Full-time | 455 |
| Regular Part-time | 415 |
| Transfer-in Part-time | 105 |
