Student Population Changes
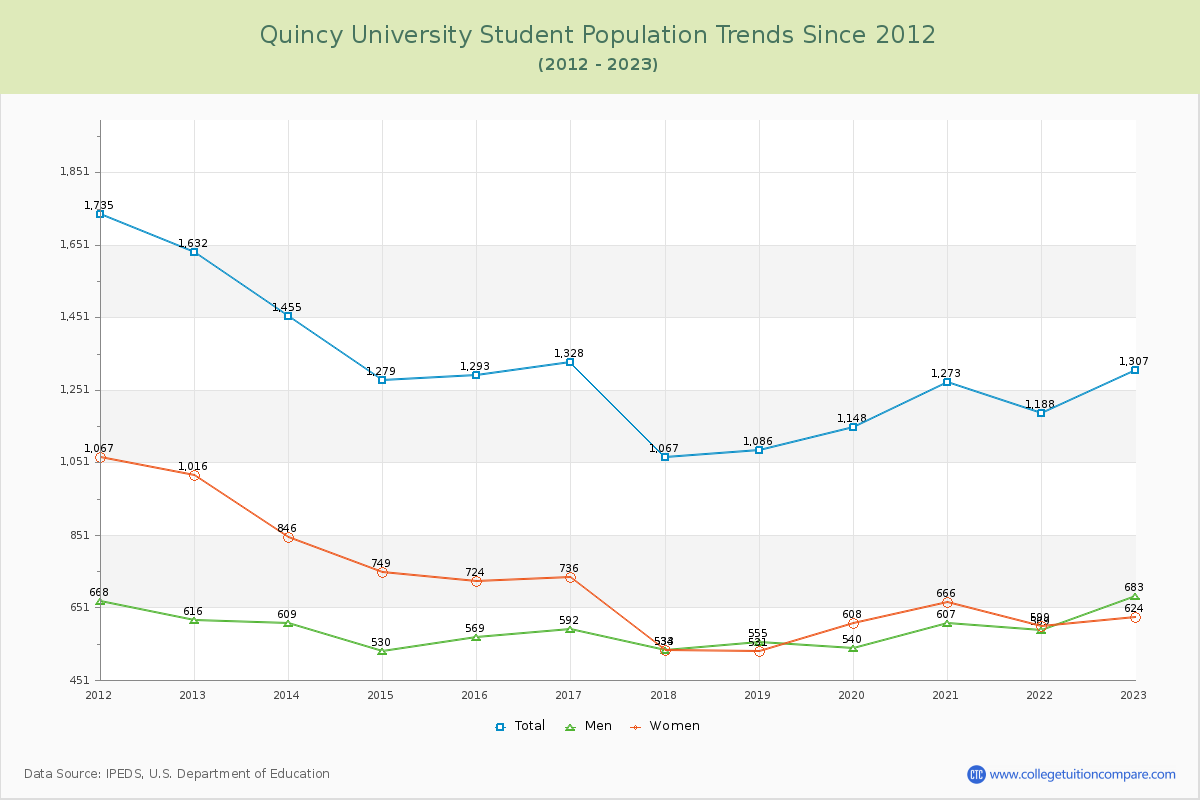
The average student population over the last 12 years is 1,278 where 1,307 students are attending the school for the academic year 2022-2023.
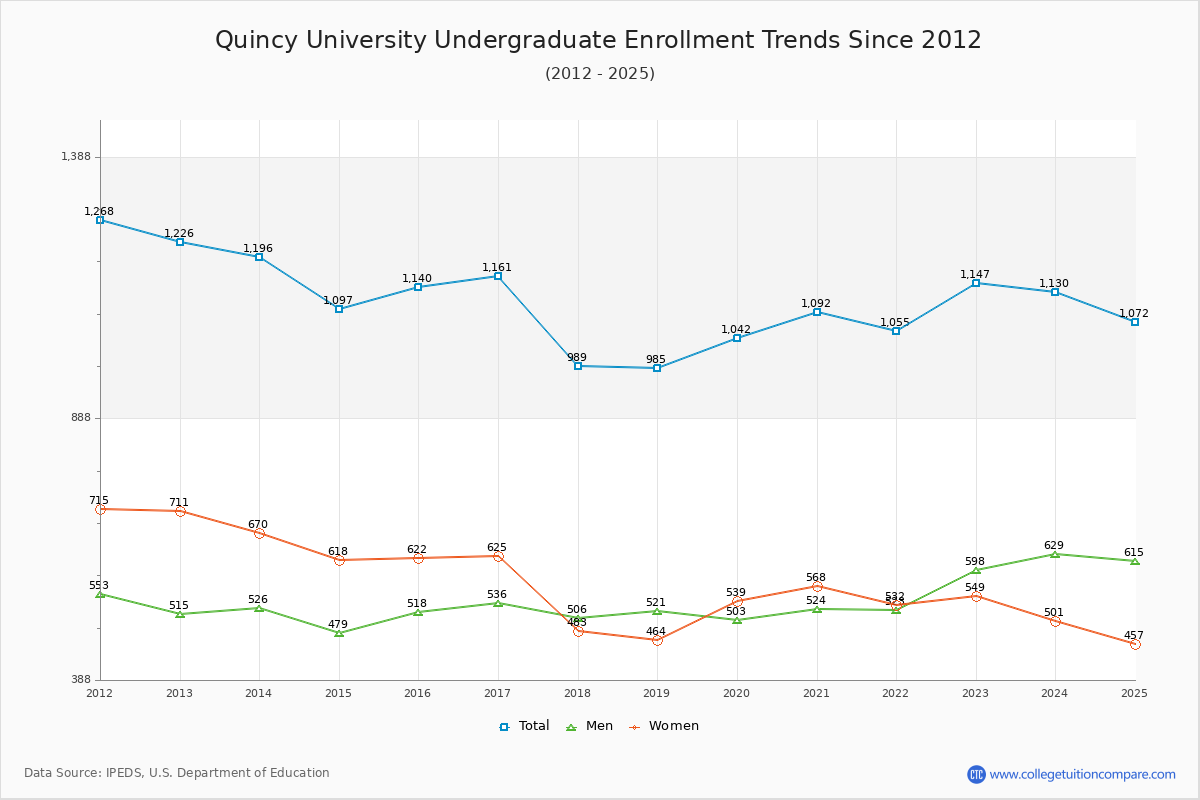
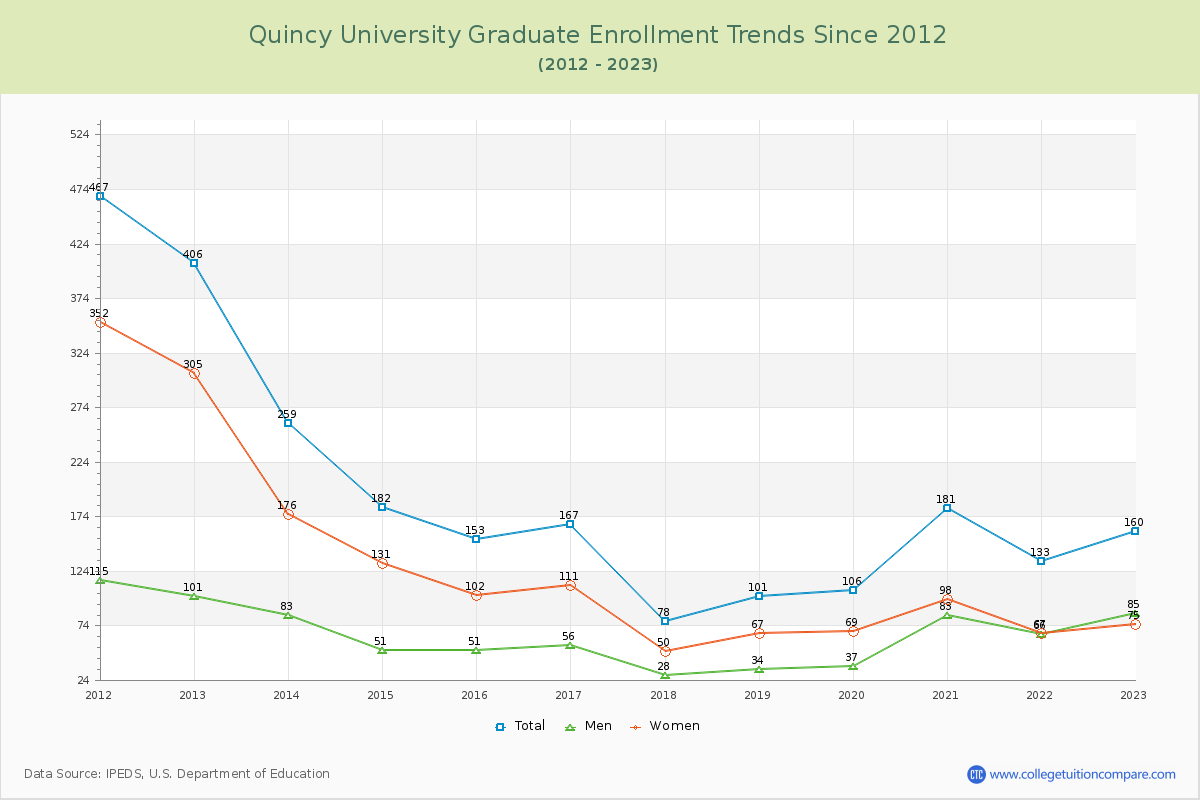
87.76% of total students is undergraduate students and 12.24% students is graduate students. The number of undergraduate students has decreased by 79 and the graduate enrollment has decreased by 246 over past 10 years.
The female to male ratio is 0.91 to 1 and it means that there are similar numbers of female and male students enrolled in Quincy.
The following table and chart illustrate the changes in student population by gender at Quincy University since 2012.
| Year | Total | Undergraduate | Graduate | ||||
|---|---|---|---|---|---|---|---|
| Total | Men | Women | Total | Men | Women | ||
| 2012-13 | 1,632 | 1,226 | 515 | 711 | 406 | 101 | 305 |
| 2013-14 | 1,455 -177 | 1,196 -30 | 526 11 | 670 -41 | 259 -147 | 83 -18 | 176 -129 |
| 2014-15 | 1,279 -176 | 1,097 -99 | 479 -47 | 618 -52 | 182 -77 | 51 -32 | 131 -45 |
| 2015-16 | 1,293 14 | 1,140 43 | 518 39 | 622 4 | 153 -29 | 51 0 | 102 -29 |
| 2016-17 | 1,328 35 | 1,161 21 | 536 18 | 625 3 | 167 14 | 56 5 | 111 9 |
| 2017-18 | 1,067 -261 | 989 -172 | 506 -30 | 483 -142 | 78 -89 | 28 -28 | 50 -61 |
| 2018-19 | 1,086 19 | 985 -4 | 521 15 | 464 -19 | 101 23 | 34 6 | 67 17 |
| 2019-20 | 1,148 62 | 1,042 57 | 503 -18 | 539 75 | 106 5 | 37 3 | 69 2 |
| 2020-21 | 1,273 125 | 1,092 50 | 524 21 | 568 29 | 181 75 | 83 46 | 98 29 |
| 2021-22 | 1,188 -85 | 1,055 -37 | 523 -1 | 532 -36 | 133 -48 | 66 -17 | 67 -31 |
| 2022-23 | 1,307 119 | 1,147 92 | 598 75 | 549 17 | 160 27 | 85 19 | 75 8 |
| Average | 1,278 | 1,103 | 523 | 580 | 175 | 61 | 114 |