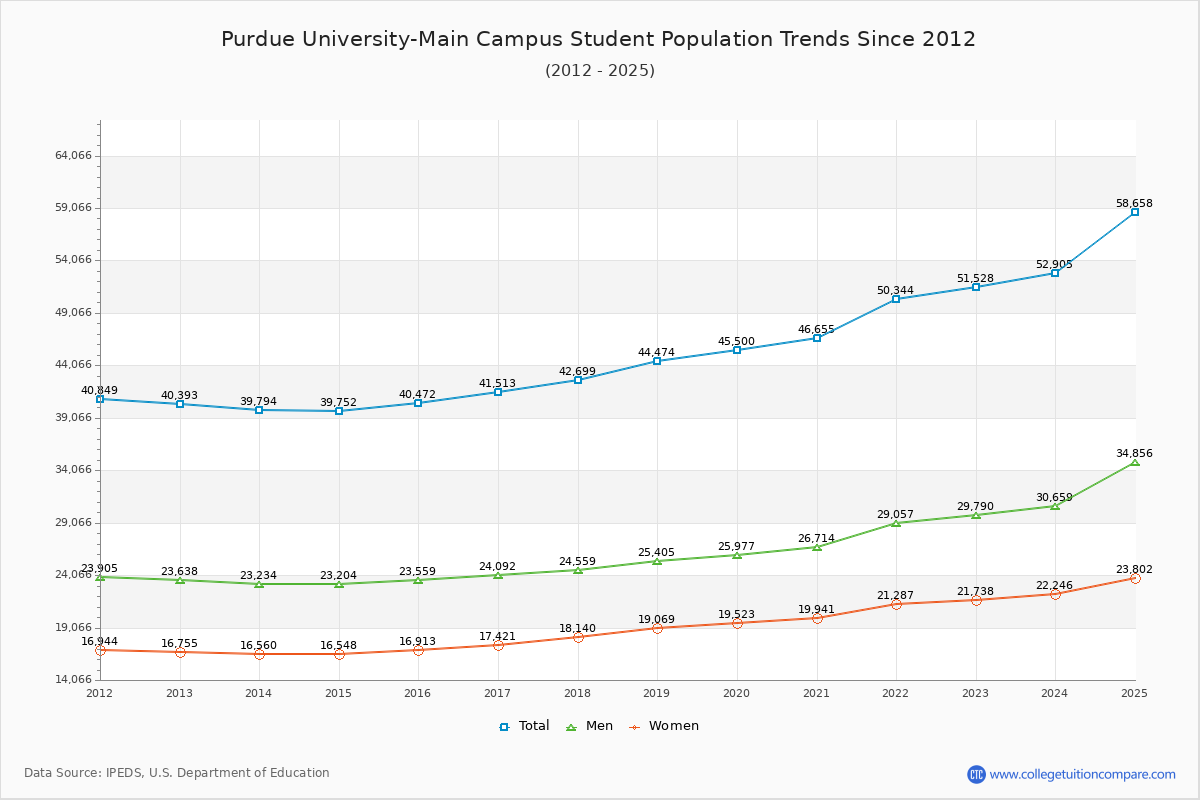
Student Population Changes
The average student population over the last 12 years is 43,920 where 51,528 students are attending the school for the academic year 2022-2023.
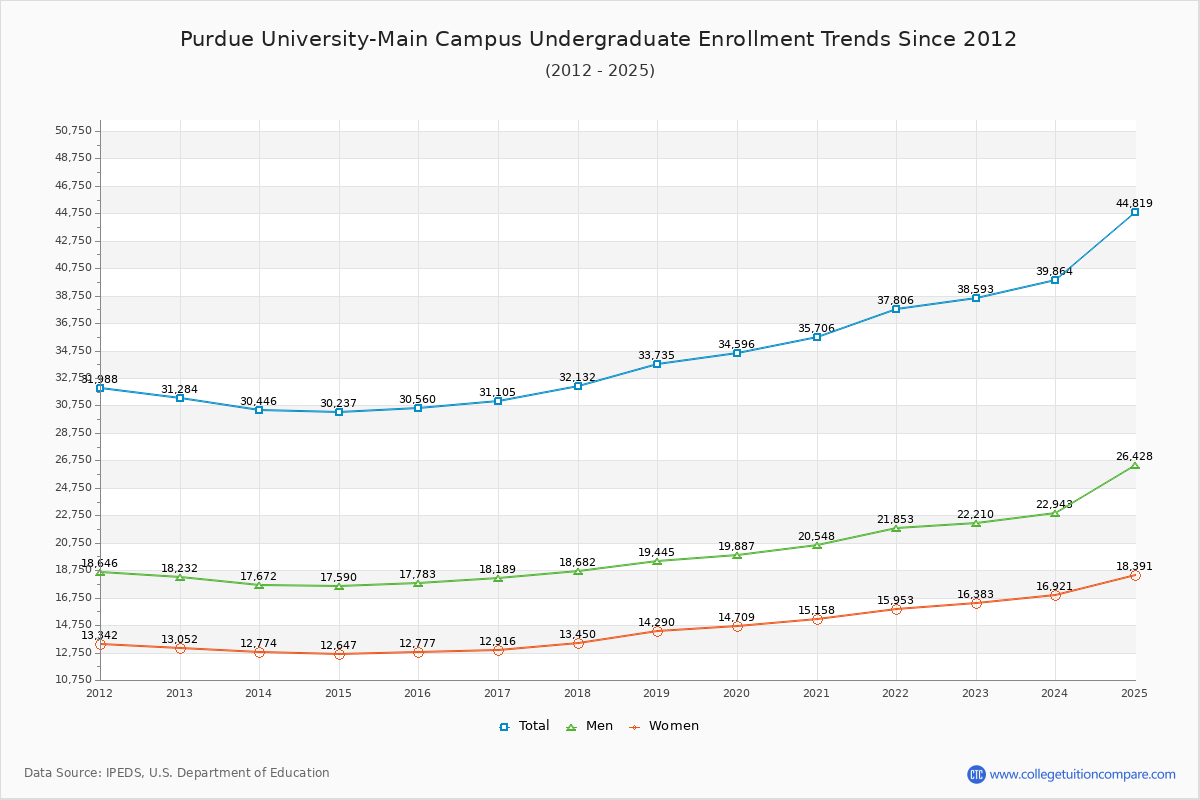
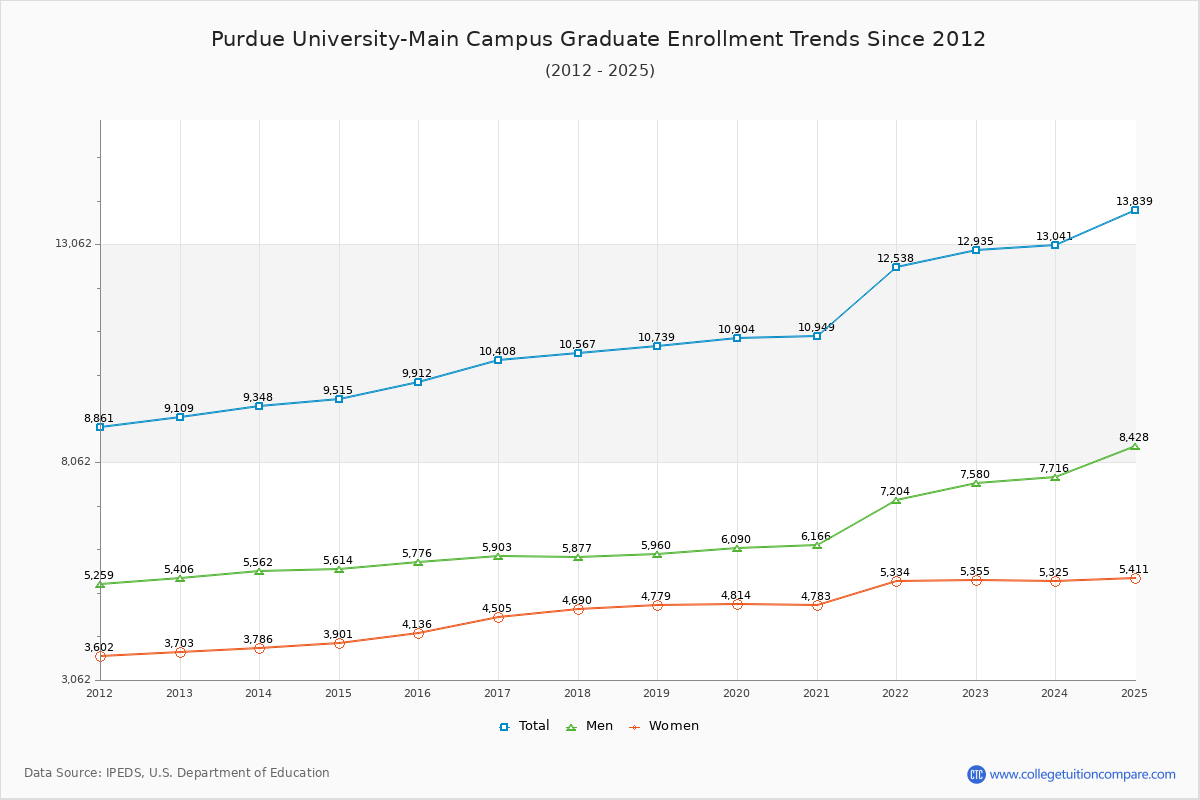
74.90% of total students is undergraduate students and 25.10% students is graduate students. The number of undergraduate students has increased by 7,309 and the graduate enrollment has increased by 3,826 over past 10 years.
The female to male ratio is 0.73 to 1 and it means that there are more male students enrolled in PU than female students.
The following table and chart illustrate the changes in student population by gender at Purdue University-Main Campus since 2012.
| Year | Total | Undergraduate | Graduate | ||||
|---|---|---|---|---|---|---|---|
| Total | Men | Women | Total | Men | Women | ||
| 2012-13 | 40,393 | 31,284 | 18,232 | 13,052 | 9,109 | 5,406 | 3,703 |
| 2013-14 | 39,794 -599 | 30,446 -838 | 17,672 -560 | 12,774 -278 | 9,348 239 | 5,562 156 | 3,786 83 |
| 2014-15 | 39,752 -42 | 30,237 -209 | 17,590 -82 | 12,647 -127 | 9,515 167 | 5,614 52 | 3,901 115 |
| 2015-16 | 40,472 720 | 30,560 323 | 17,783 193 | 12,777 130 | 9,912 397 | 5,776 162 | 4,136 235 |
| 2016-17 | 41,513 1,041 | 31,105 545 | 18,189 406 | 12,916 139 | 10,408 496 | 5,903 127 | 4,505 369 |
| 2017-18 | 42,699 1,186 | 32,132 1,027 | 18,682 493 | 13,450 534 | 10,567 159 | 5,877 -26 | 4,690 185 |
| 2018-19 | 44,474 1,775 | 33,735 1,603 | 19,445 763 | 14,290 840 | 10,739 172 | 5,960 83 | 4,779 89 |
| 2019-20 | 45,500 1,026 | 34,596 861 | 19,887 442 | 14,709 419 | 10,904 165 | 6,090 130 | 4,814 35 |
| 2020-21 | 46,655 1,155 | 35,706 1,110 | 20,548 661 | 15,158 449 | 10,949 45 | 6,166 76 | 4,783 -31 |
| 2021-22 | 50,344 3,689 | 37,806 2,100 | 21,853 1,305 | 15,953 795 | 12,538 1,589 | 7,204 1,038 | 5,334 551 |
| 2022-23 | 51,528 1,184 | 38,593 787 | 22,210 357 | 16,383 430 | 12,935 397 | 7,580 376 | 5,355 21 |
| Average | 43,920 | 33,291 | 19,281 | 14,010 | 10,629 | 6,103 | 4,526 |