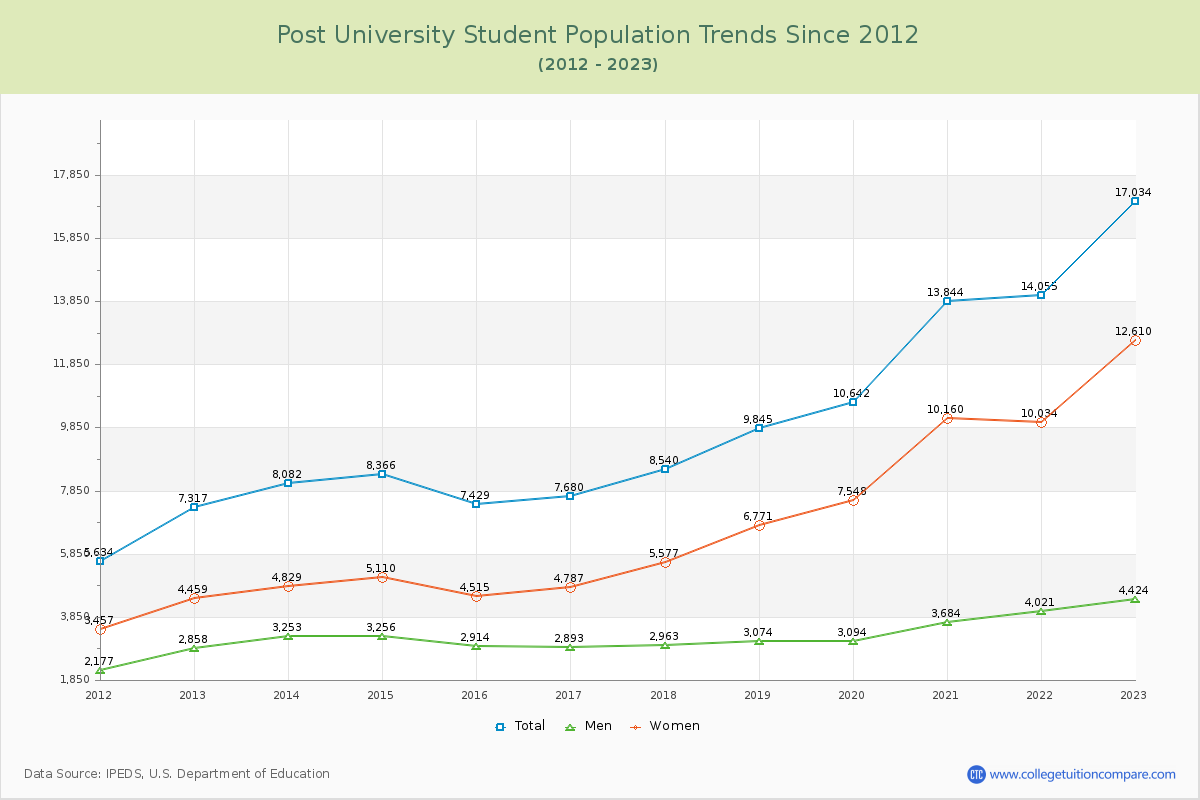
Student Population Changes
The average student population over the last 12 years is 10,258 where 17,034 students are attending the school for the academic year 2022-2023.
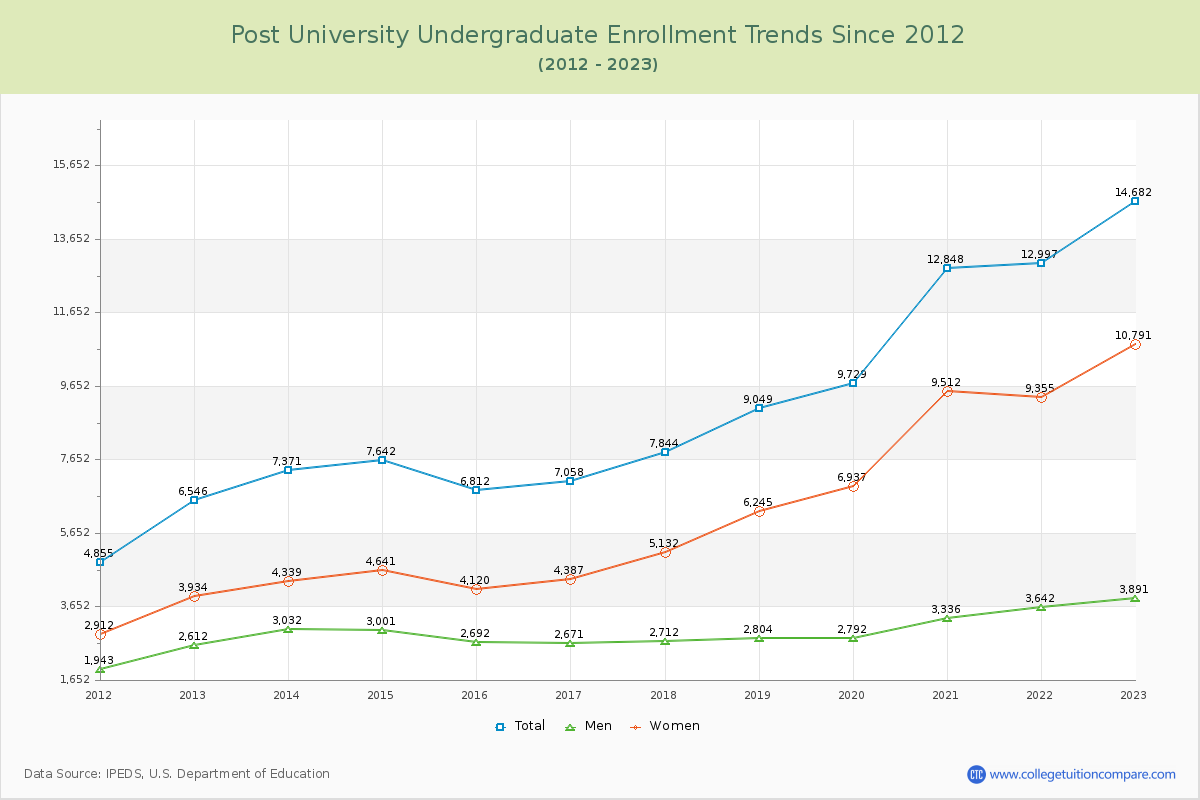
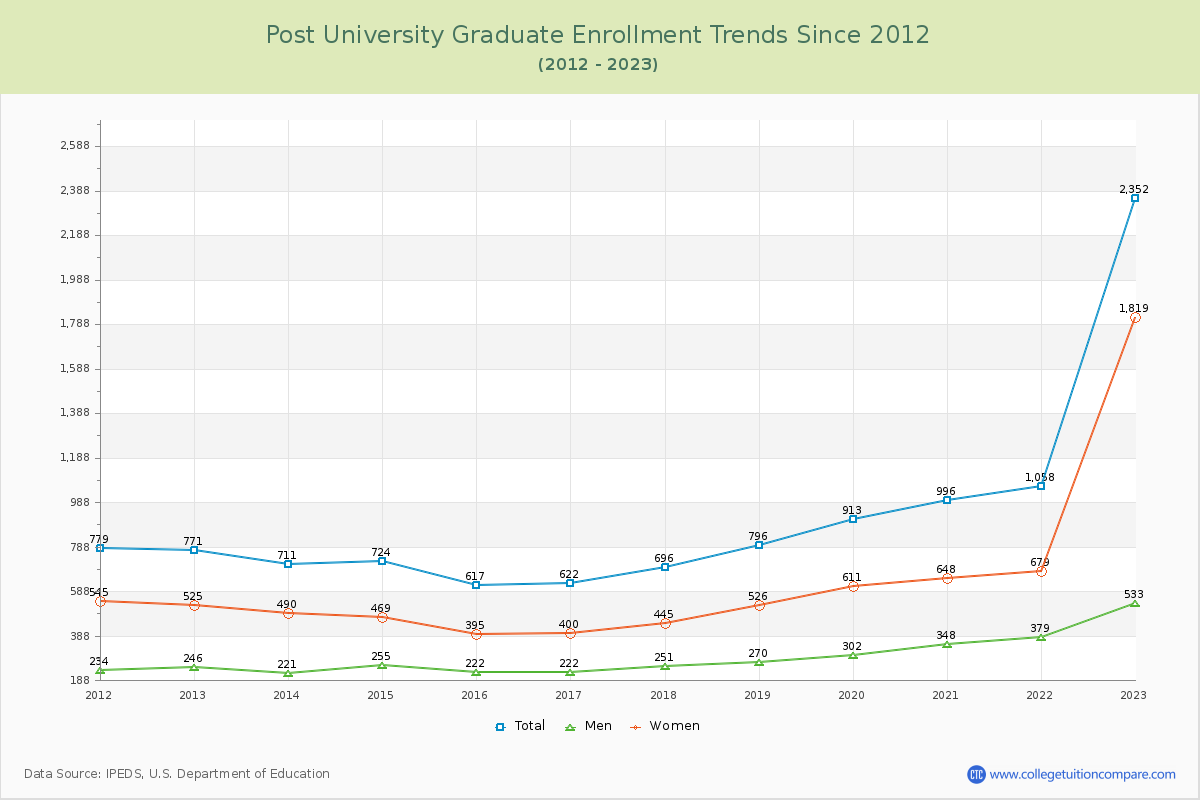
86.19% of total students is undergraduate students and 13.81% students is graduate students. The number of undergraduate students has increased by 8,136 and the graduate enrollment has increased by 1,581 over past 10 years.
The female to male ratio is 2.85 to 1 and it means that there are far more female students enrolled in Post than male students.
The following table and chart illustrate the changes in student population by gender at Post University since 2012.
| Year | Total | Undergraduate | Graduate | ||||
|---|---|---|---|---|---|---|---|
| Total | Men | Women | Total | Men | Women | ||
| 2012-13 | 7,317 | 6,546 | 2,612 | 3,934 | 771 | 246 | 525 |
| 2013-14 | 8,082 765 | 7,371 825 | 3,032 420 | 4,339 405 | 711 -60 | 221 -25 | 490 -35 |
| 2014-15 | 8,366 284 | 7,642 271 | 3,001 -31 | 4,641 302 | 724 13 | 255 34 | 469 -21 |
| 2015-16 | 7,429 -937 | 6,812 -830 | 2,692 -309 | 4,120 -521 | 617 -107 | 222 -33 | 395 -74 |
| 2016-17 | 7,680 251 | 7,058 246 | 2,671 -21 | 4,387 267 | 622 5 | 222 0 | 400 5 |
| 2017-18 | 8,540 860 | 7,844 786 | 2,712 41 | 5,132 745 | 696 74 | 251 29 | 445 45 |
| 2018-19 | 9,845 1,305 | 9,049 1,205 | 2,804 92 | 6,245 1,113 | 796 100 | 270 19 | 526 81 |
| 2019-20 | 10,642 797 | 9,729 680 | 2,792 -12 | 6,937 692 | 913 117 | 302 32 | 611 85 |
| 2020-21 | 13,844 3,202 | 12,848 3,119 | 3,336 544 | 9,512 2,575 | 996 83 | 348 46 | 648 37 |
| 2021-22 | 14,055 211 | 12,997 149 | 3,642 306 | 9,355 -157 | 1,058 62 | 379 31 | 679 31 |
| 2022-23 | 17,034 2,979 | 14,682 1,685 | 3,891 249 | 10,791 1,436 | 2,352 1,294 | 533 154 | 1,819 1,140 |
| Average | 10,258 | 9,325 | 3,017 | 6,308 | 932 | 295 | 637 |