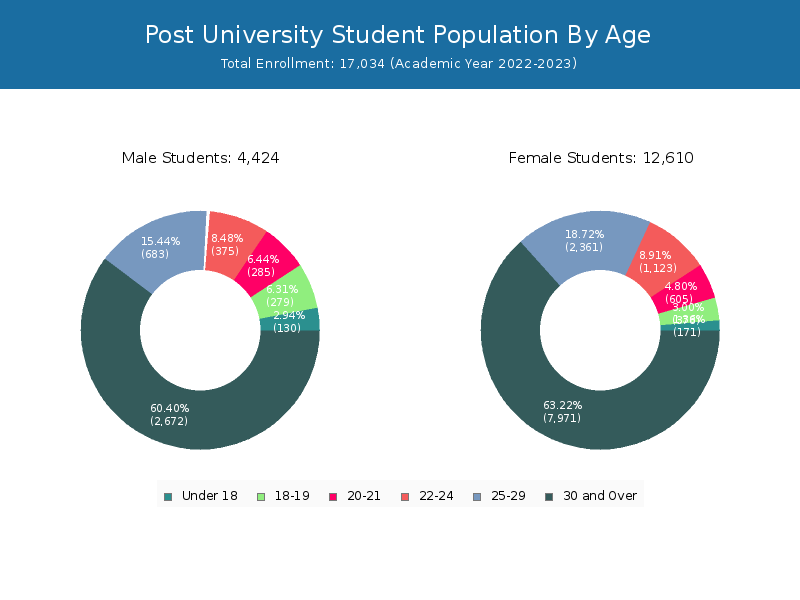
Student Population by Gender
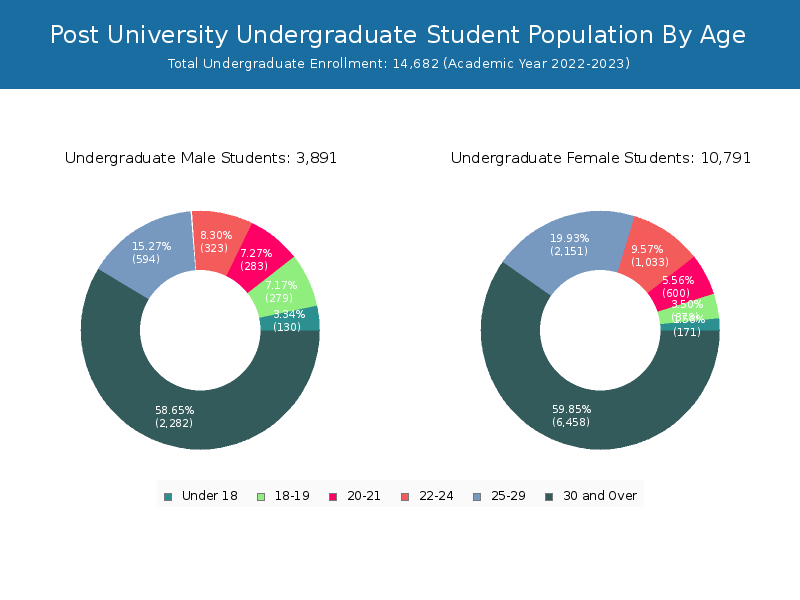
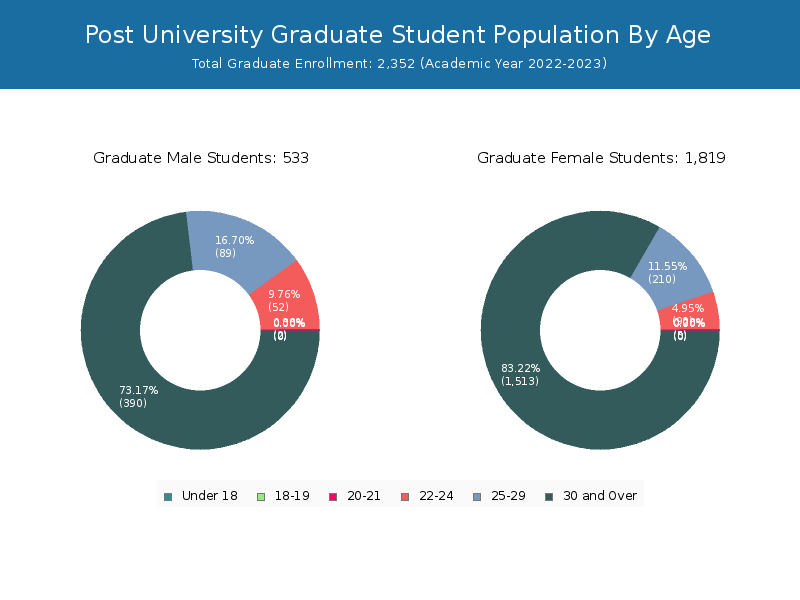
Post University has a total of 17,034 enrolled students for the academic year 2022-2023. 14,682 students have enrolled in undergraduate programs and 2,352 students joined graduate programs.
By gender, 4,424 male and 12,610 female students (the male-female ratio is 26:74) are attending the school. The gender distribution is based on the 2022-2023 data.
| Total | Undergraduate | Graduate | |
|---|---|---|---|
| Total | 17,034 | 14,682 | 2,352 |
| Men | 4,424 | 3,891 | 533 |
| Women | 12,610 | 10,791 | 1,819 |
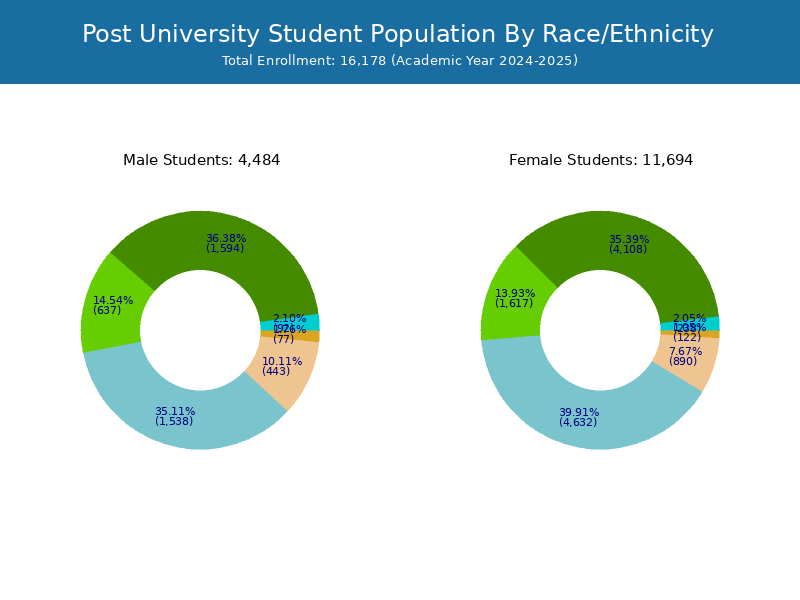
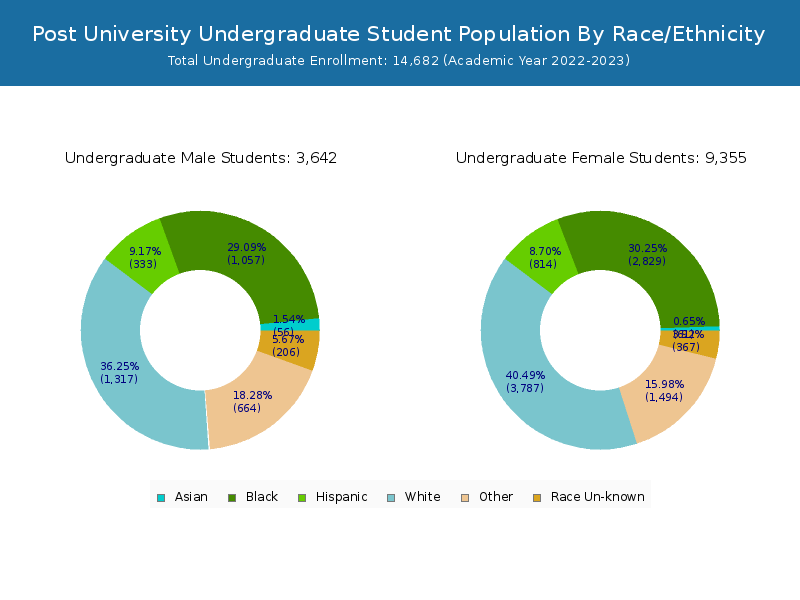
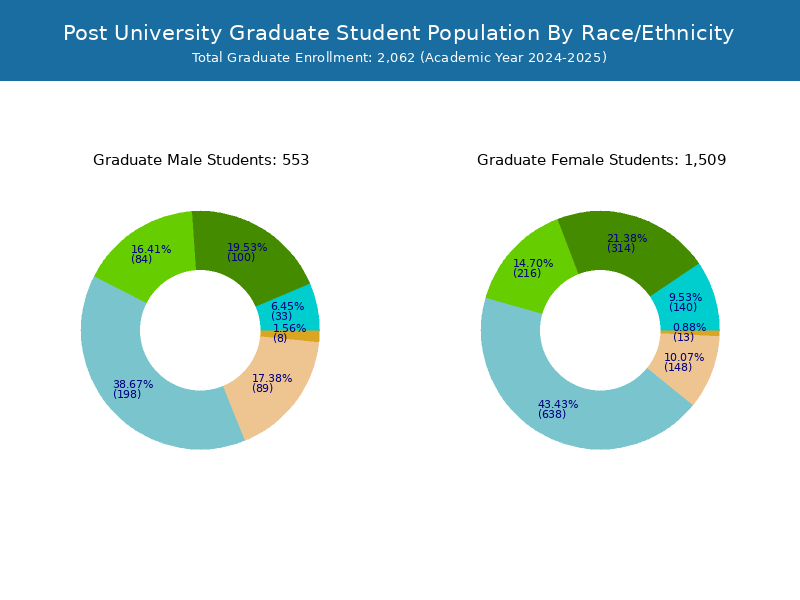
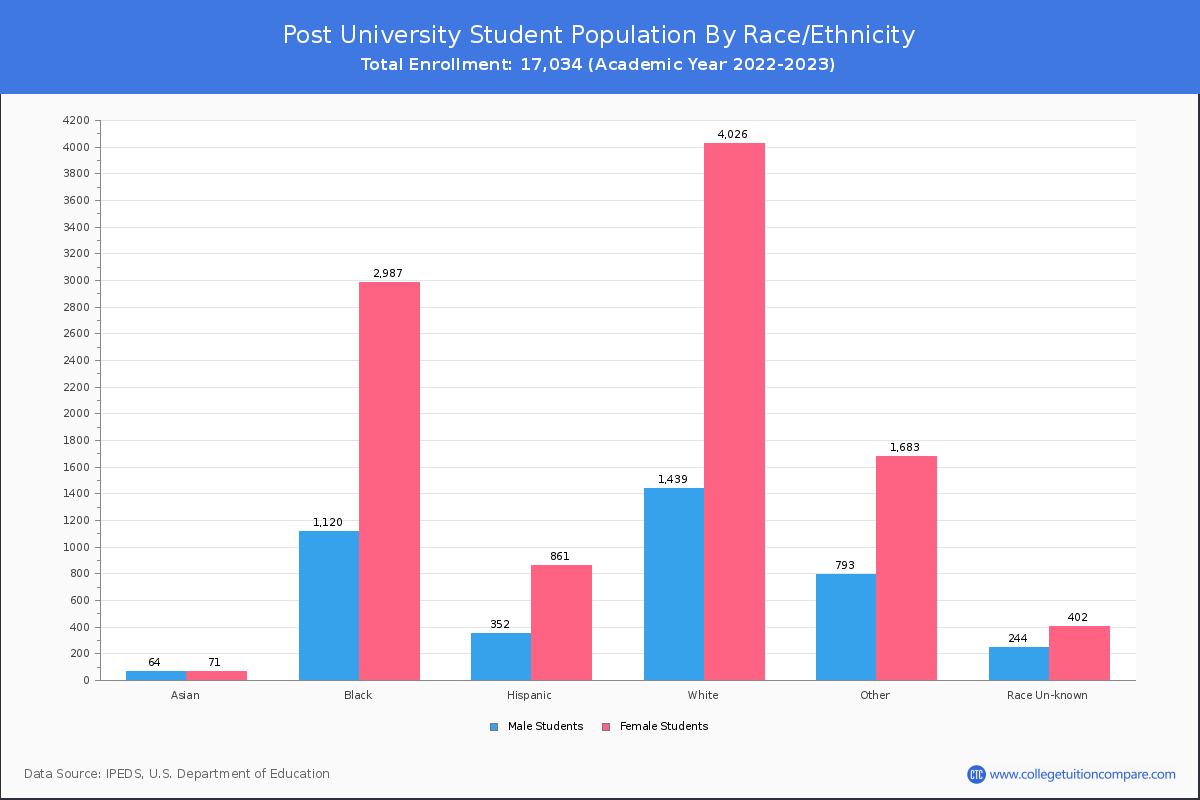
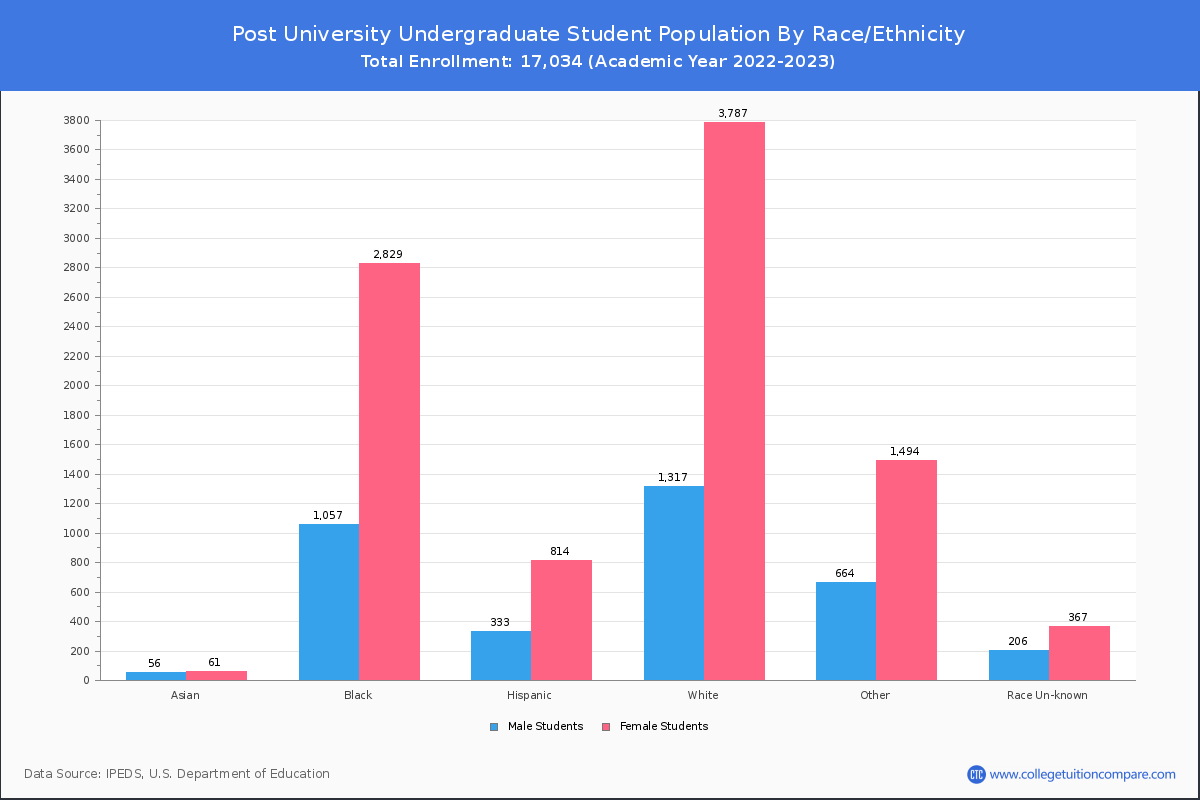
Student Distribution by Race/Ethnicity
By race/ethnicity, 7,084 White, 5,088 Black, and 323 Asian students out of a total of 17,034 are attending at Post University. Comprehensive enrollment statistic data by race/ethnicity is shown in the next chart (Academic year 2022-2023 data).
| Race | Total | Men | Women |
|---|---|---|---|
| American Indian or Native American | 141 | 31 | 110 |
| Asian | 323 | 104 | 219 |
| Black | 5,088 | 1,284 | 3,804 |
| Hispanic | 2,475 | 678 | 1,797 |
| Native Hawaiian or Other Pacific Islanders | 75 | 15 | 60 |
| White | 7,084 | 1,699 | 5,385 |
| Two or more races | 1,274 | 414 | 860 |
| Race Unknown | 565 | 192 | 373 |
| Race | Total | Men | Women |
|---|---|---|---|
| American Indian or Native American | 123 | 30 | 93 |
| Asian | 158 | 68 | 90 |
| Black | 4,636 | 1,177 | 3,459 |
| Hispanic | 2,181 | 602 | 1,579 |
| Native Hawaiian or Other Pacific Islanders | 60 | 13 | 47 |
| White | 6,078 | 1,516 | 4,562 |
| Two or more races | 1,035 | 326 | 709 |
| Race Unknown | 402 | 152 | 250 |
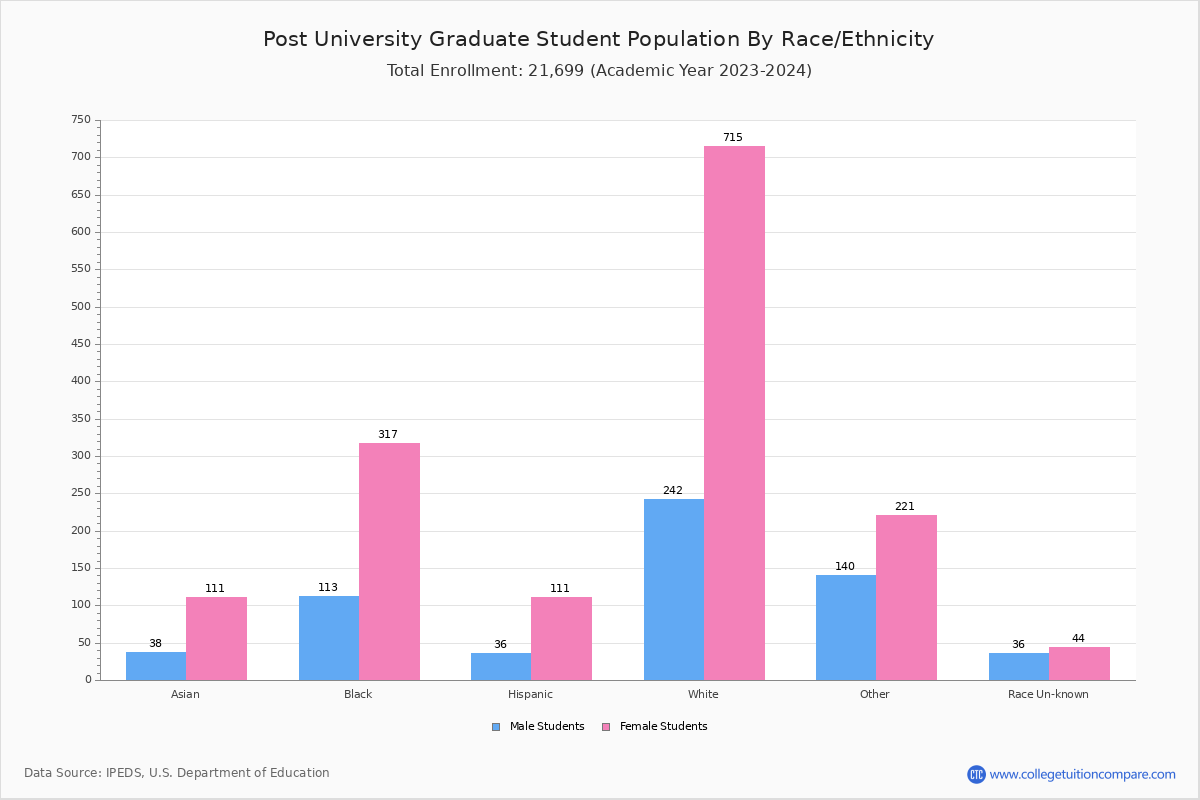
| Race | Total | Men | Women |
|---|---|---|---|
| American Indian or Native American | 22 | 3 | 19 |
| Asian | 29 | 7 | 22 |
| Black | 850 | 196 | 654 |
| Hispanic | 248 | 57 | 191 |
| Native Hawaiian or Other Pacific Islanders | 6 | 2 | 4 |
| White | 899 | 165 | 734 |
| Two or more races | 105 | 22 | 83 |
| Race Unknown | 35 | 12 | 23 |
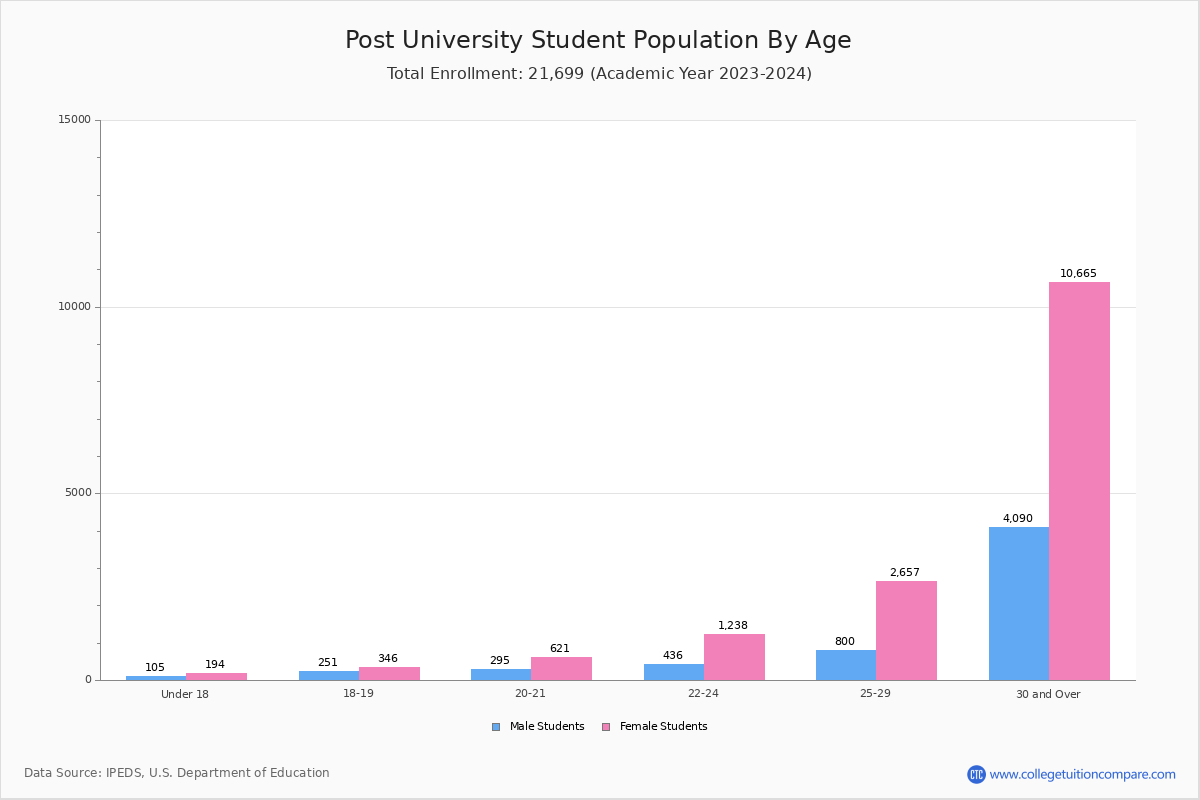
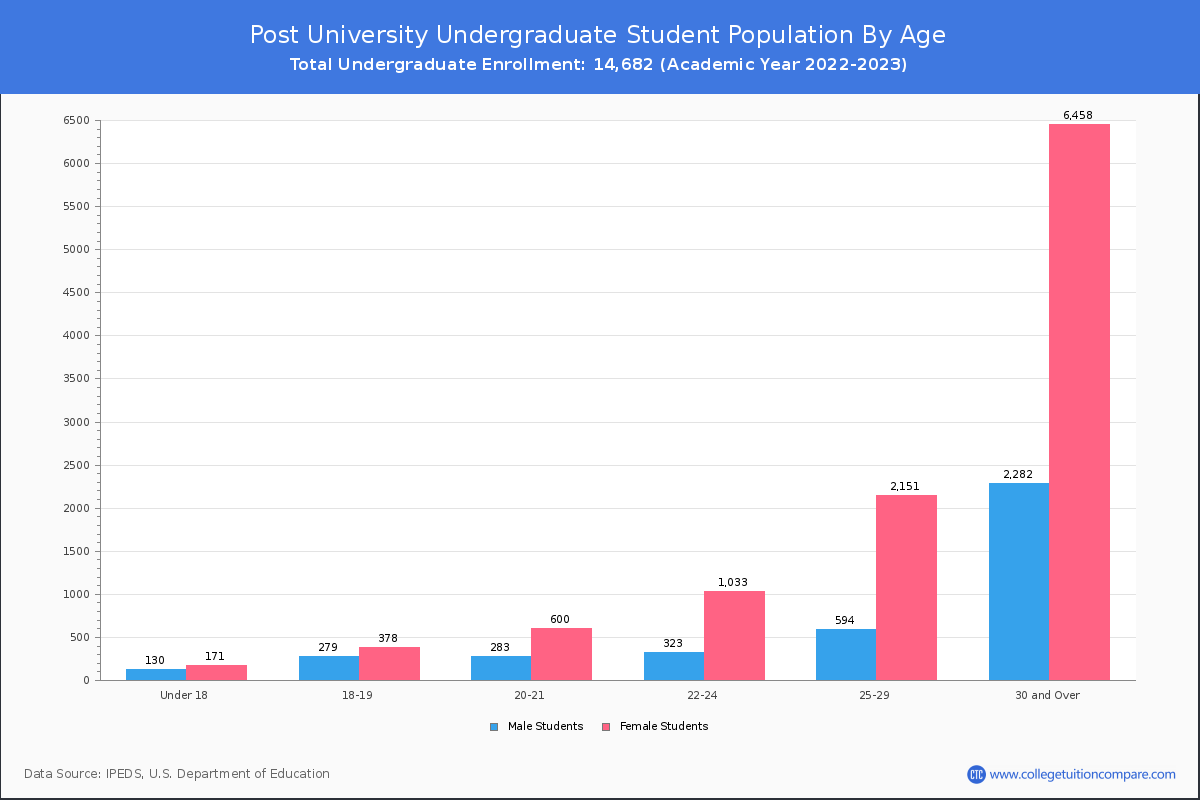
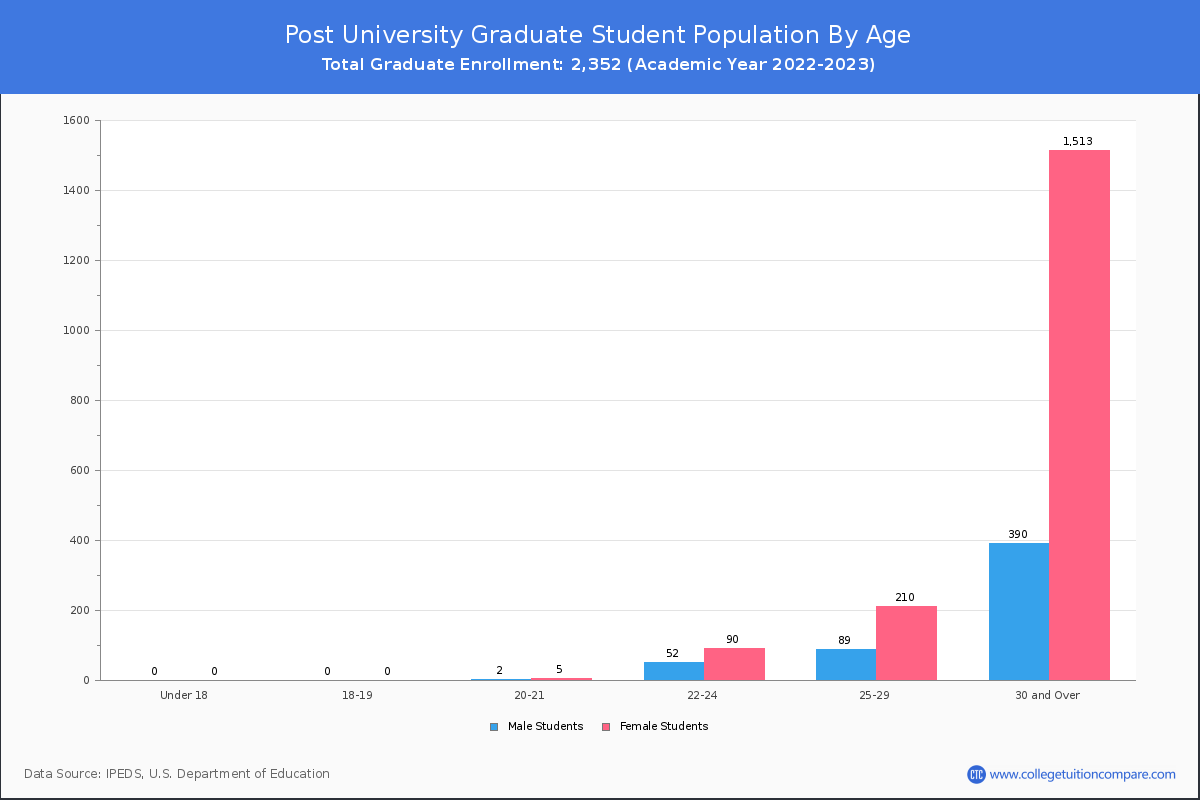
Student Age Distribution
By age, Post has 301 students under 18 years old and 241 students over 65 years old. There are 3,346 students under 25 years old, and 13,687 students over 25 years old out of 17,034 total students.
In undergraduate programs, 301 students are younger than 18 and 196 students are older than 65. Post has 3,197 undergraduate students aged under 25 and 11,485 students aged 25 and over.
It has 149 graduate students aged under 25 and 2,202 students aged 25 and over.
| Age | Total | Men | Women |
|---|---|---|---|
| Under 18 | 301 | 171 | 130 |
| 18-19 | 657 | 378 | 279 |
| 20-21 | 890 | 605 | 285 |
| 22-24 | 1,498 | 1,123 | 375 |
| 25-29 | 3,044 | 2,361 | 683 |
| 30-34 | 2,866 | 2,150 | 716 |
| 35-39 | 2,609 | 1,893 | 716 |
| 40-49 | 3,301 | 2,484 | 817 |
| 50-64 | 1,626 | 1,281 | 345 |
| Over 65 | 241 | 163 | 78 |
| Age | Total | Men | Women |
|---|---|---|---|
| Under 18 | 301 | 171 | 130 |
| 18-19 | 657 | 378 | 279 |
| 20-21 | 883 | 600 | 283 |
| 22-24 | 1,356 | 1,033 | 323 |
| 25-29 | 2,745 | 2,151 | 594 |
| 30-34 | 2,513 | 1,869 | 644 |
| 35-39 | 2,186 | 1,581 | 605 |
| 40-49 | 2,663 | 1,969 | 694 |
| 50-64 | 1,182 | 906 | 276 |
| Over 65 | 196 | 133 | 63 |
| Age | Total | Men | Women |
|---|
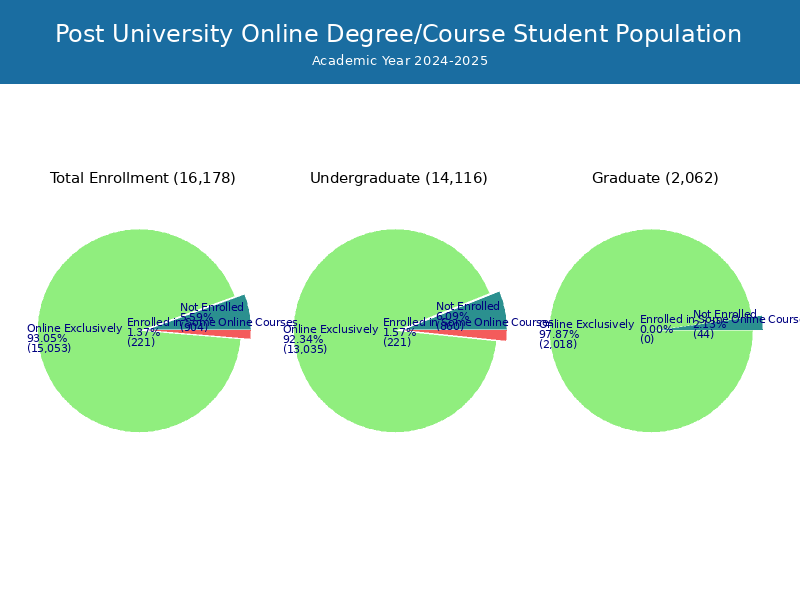
Online Student Enrollment
Distance learning, also called online education, is very attractive to students, especially who want to continue education and work in field. At Post University, 15,984 students are enrolled exclusively in online courses and 304 students are enrolled in some online courses.
1,954 students lived in Connecticut or jurisdiction in which the school is located are enrolled exclusively in online courses and 14,030 students live in other State or outside of the United States.
| All Students | Enrolled Exclusively Online Courses | Enrolled in Some Online Courses | |
|---|---|---|---|
| All Students | 17,034 | 15,984 | 304 |
| Undergraduate | 14,682 | 13,632 | 304 |
| Graduate | 2,352 | 2,352 | 0 |
| Connecticut Residents | Other States in U.S. | Outside of U.S. | |
|---|---|---|---|
| All Students | 1,954 | 14,028 | 2 |
| Undergraduate | 1,416 | 12,214 | 2 |
| Graduate | 538 | 1,814 | 0 |
Transfer-in Students (Undergraduate)
Among 14,682 enrolled in undergraduate programs, 2,195 students have transferred-in from other institutions. The percentage of transfer-in students is 14.95%.1,243 students have transferred in as full-time status and 952 students transferred in as part-time status.
| Number of Students | |
|---|---|
| Regular Full-time | 4,805 |
| Transfer-in Full-time | 1,243 |
| Regular Part-time | 7,682 |
| Transfer-in Part-time | 952 |