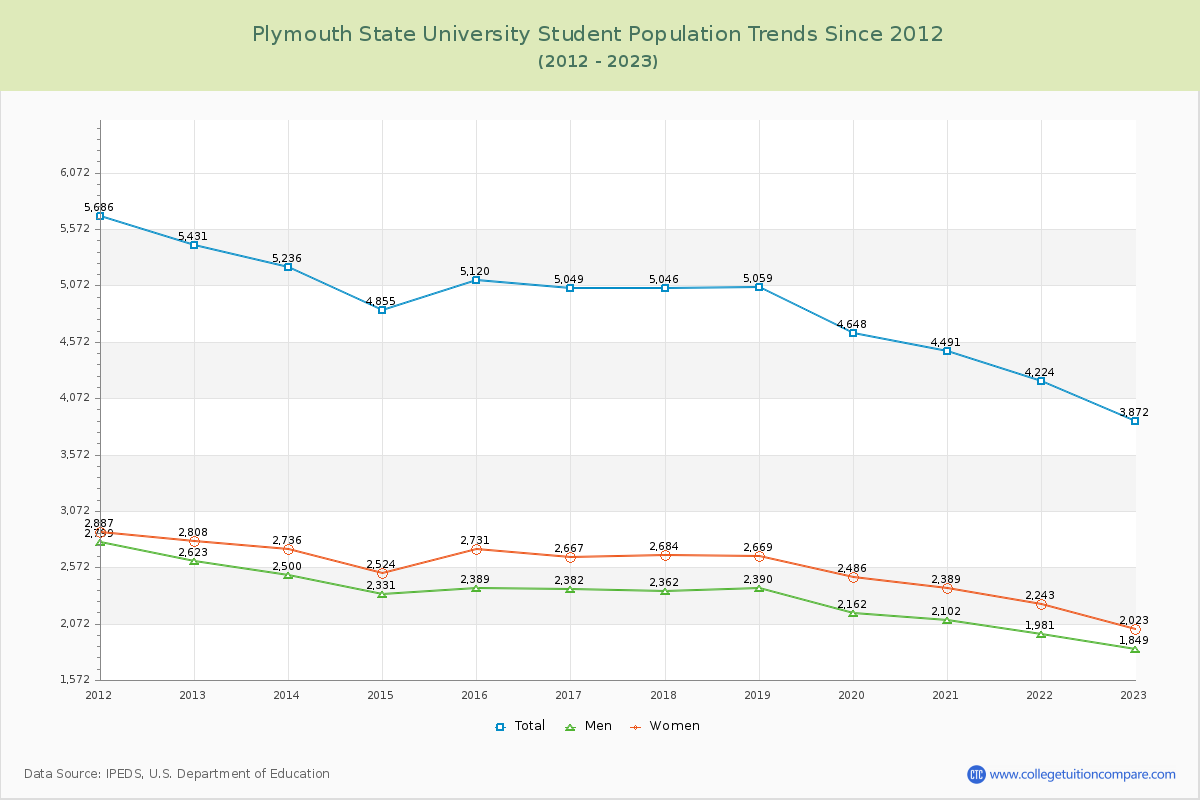
Student Population Changes
The average student population over the last 12 years is 4,821 where 3,872 students are attending the school for the academic year 2022-2023.
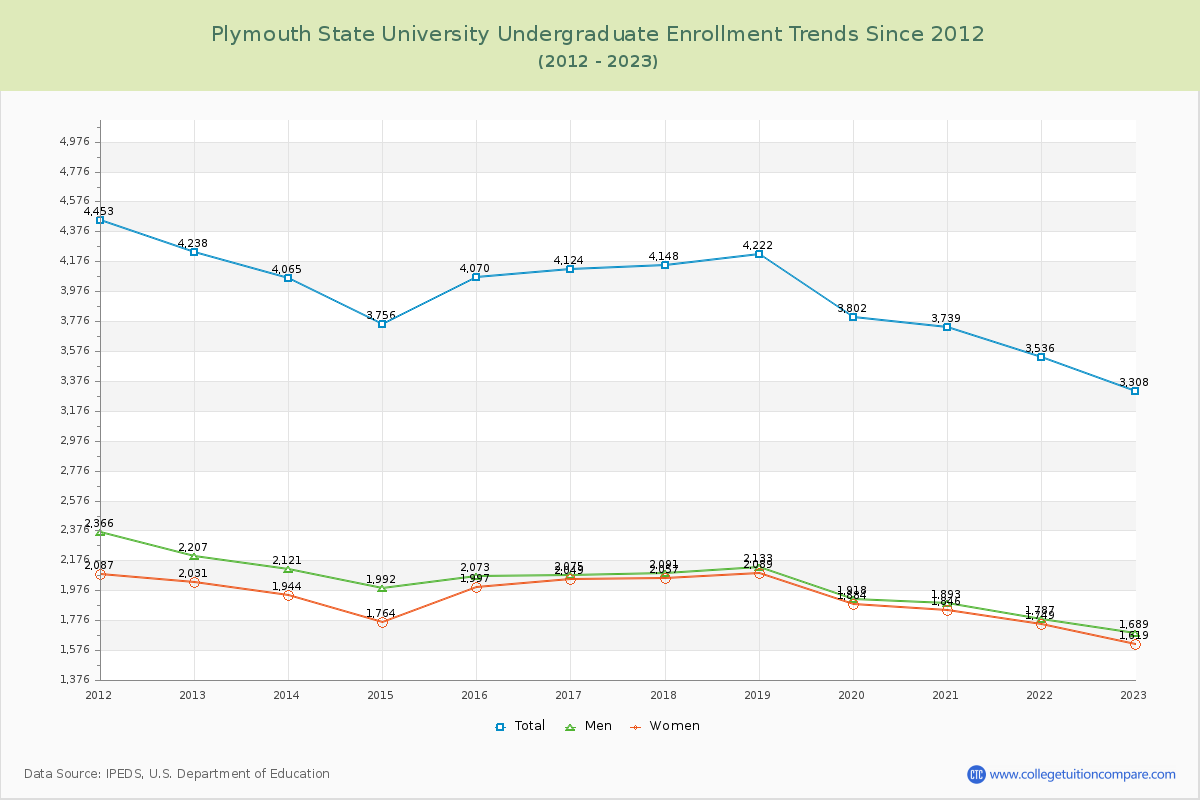
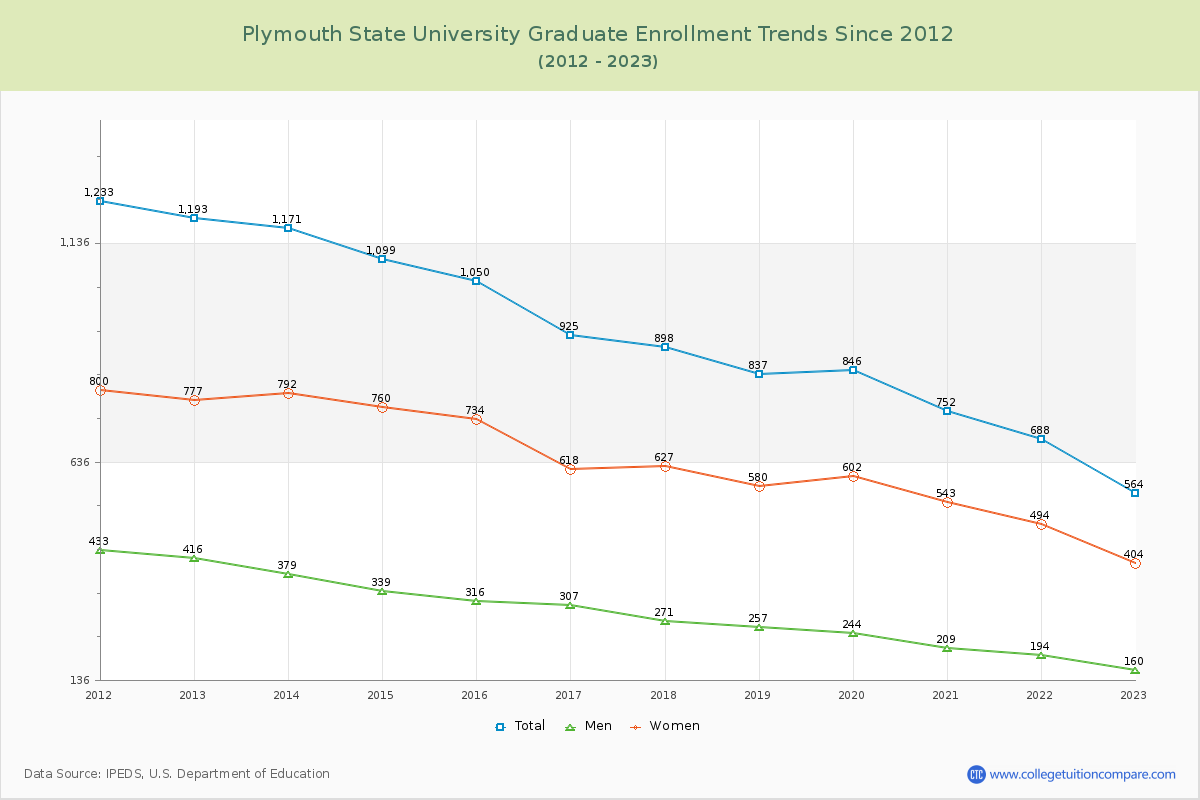
85.43% of total students is undergraduate students and 14.57% students is graduate students. The number of undergraduate students has decreased by 930 and the graduate enrollment has decreased by 629 over past 10 years.
The female to male ratio is 1.09 to 1 and it means that there are similar numbers of female and male students enrolled in PSU.
The following table and chart illustrate the changes in student population by gender at Plymouth State University since 2012.
| Year | Total | Undergraduate | Graduate | ||||
|---|---|---|---|---|---|---|---|
| Total | Men | Women | Total | Men | Women | ||
| 2012-13 | 5,431 | 4,238 | 2,207 | 2,031 | 1,193 | 416 | 777 |
| 2013-14 | 5,236 -195 | 4,065 -173 | 2,121 -86 | 1,944 -87 | 1,171 -22 | 379 -37 | 792 15 |
| 2014-15 | 4,855 -381 | 3,756 -309 | 1,992 -129 | 1,764 -180 | 1,099 -72 | 339 -40 | 760 -32 |
| 2015-16 | 5,120 265 | 4,070 314 | 2,073 81 | 1,997 233 | 1,050 -49 | 316 -23 | 734 -26 |
| 2016-17 | 5,049 -71 | 4,124 54 | 2,075 2 | 2,049 52 | 925 -125 | 307 -9 | 618 -116 |
| 2017-18 | 5,046 -3 | 4,148 24 | 2,091 16 | 2,057 8 | 898 -27 | 271 -36 | 627 9 |
| 2018-19 | 5,059 13 | 4,222 74 | 2,133 42 | 2,089 32 | 837 -61 | 257 -14 | 580 -47 |
| 2019-20 | 4,648 -411 | 3,802 -420 | 1,918 -215 | 1,884 -205 | 846 9 | 244 -13 | 602 22 |
| 2020-21 | 4,491 -157 | 3,739 -63 | 1,893 -25 | 1,846 -38 | 752 -94 | 209 -35 | 543 -59 |
| 2021-22 | 4,224 -267 | 3,536 -203 | 1,787 -106 | 1,749 -97 | 688 -64 | 194 -15 | 494 -49 |
| 2022-23 | 3,872 -352 | 3,308 -228 | 1,689 -98 | 1,619 -130 | 564 -124 | 160 -34 | 404 -90 |
| Average | 4,821 | 3,910 | 1,998 | 1,912 | 911 | 281 | 630 |