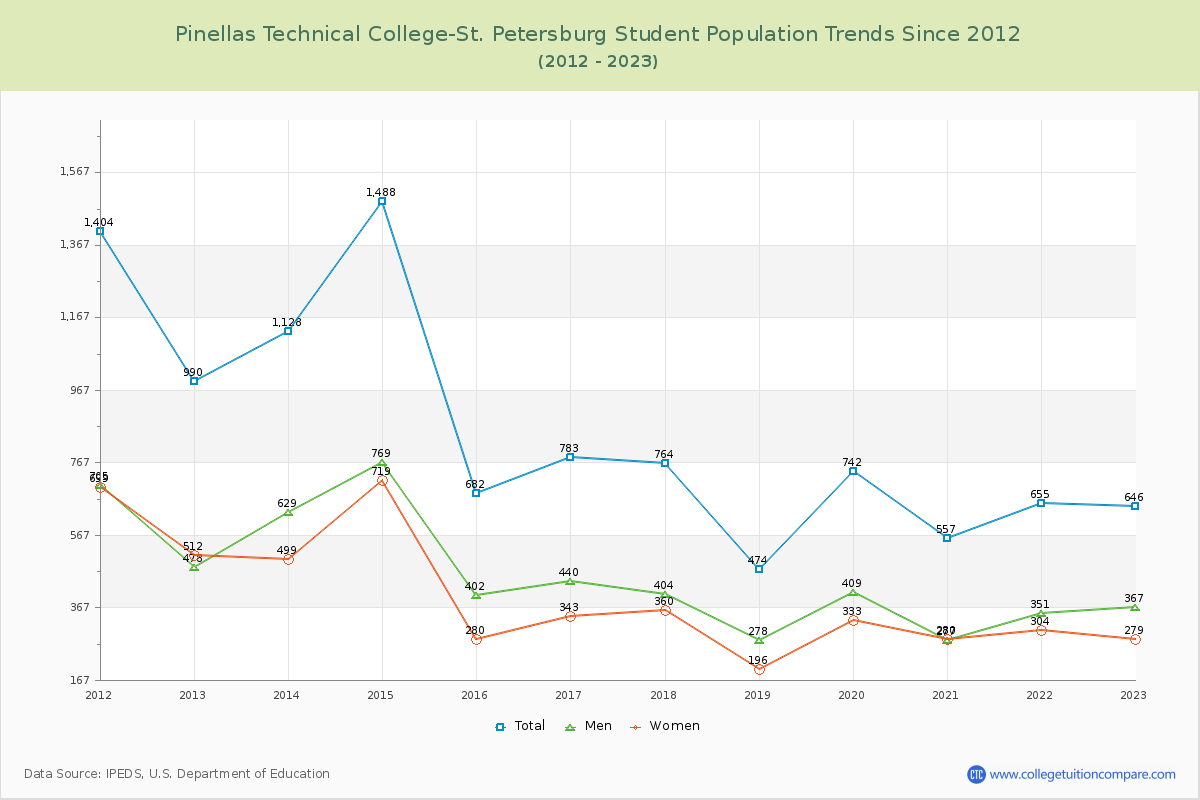
Student Population Changes
The average student population over the last 12 years is 810 where 646 students are attending the school for the academic year 2022-2023.
The female to male ratio is 0.76 to 1 and it means that there are more male students enrolled in Pinellas Technical College-St. Petersburg than female students.
The following table and chart illustrate the changes in student population by gender at Pinellas Technical College-St. Petersburg since 2012.
| Year | Total | Men | Women |
|---|---|---|---|
| 2012-13 | 990 | 478 | 512 |
| 2013-14 | 1,128 138 | 629 151 | 499 -13 |
| 2014-15 | 1,488 360 | 769 140 | 719 220 |
| 2015-16 | 682 -806 | 402 -367 | 280 -439 |
| 2016-17 | 783 101 | 440 38 | 343 63 |
| 2017-18 | 764 -19 | 404 -36 | 360 17 |
| 2018-19 | 474 -290 | 278 -126 | 196 -164 |
| 2019-20 | 742 268 | 409 131 | 333 137 |
| 2020-21 | 557 -185 | 277 -132 | 280 -53 |
| 2021-22 | 655 98 | 351 74 | 304 24 |
| 2022-23 | 646 -9 | 367 16 | 279 -25 |
| Average | 810 | 437 | 373 |