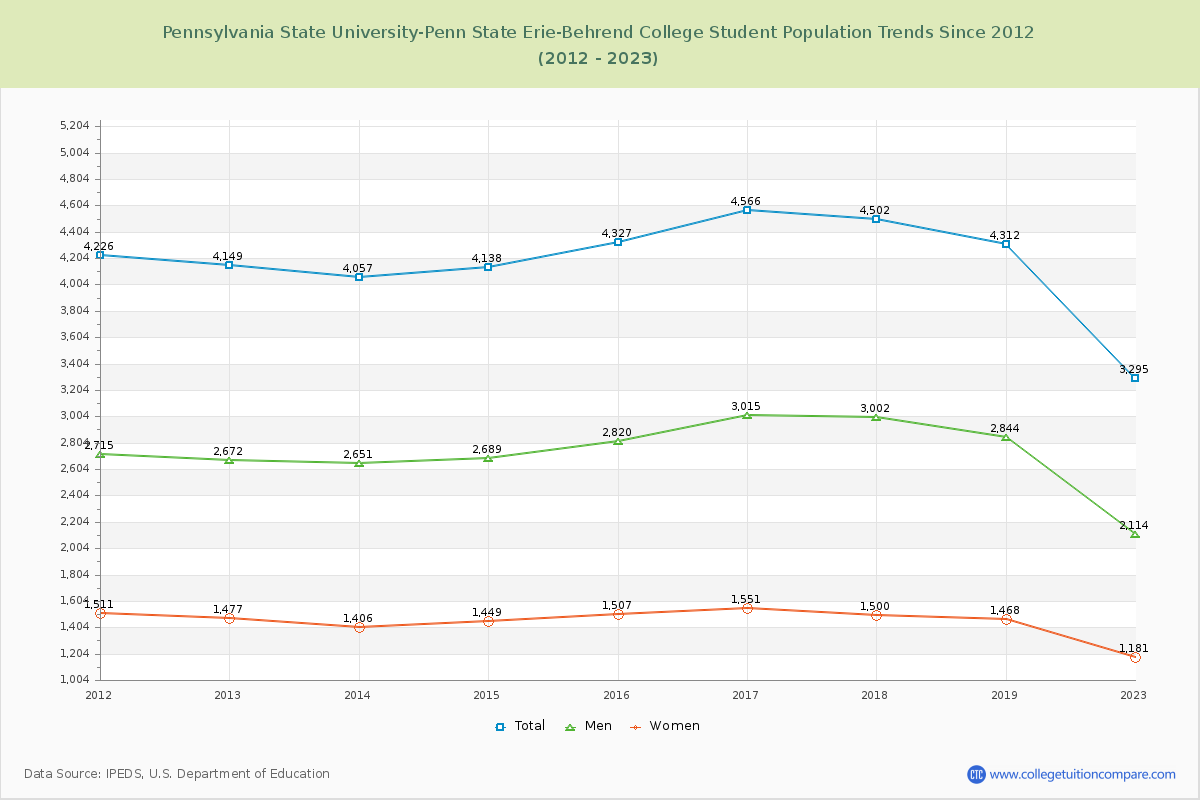
Student Population Changes
The average student population over the last 12 years is 3,031 where 3,295 students are attending the school for the academic year 2022-2023.
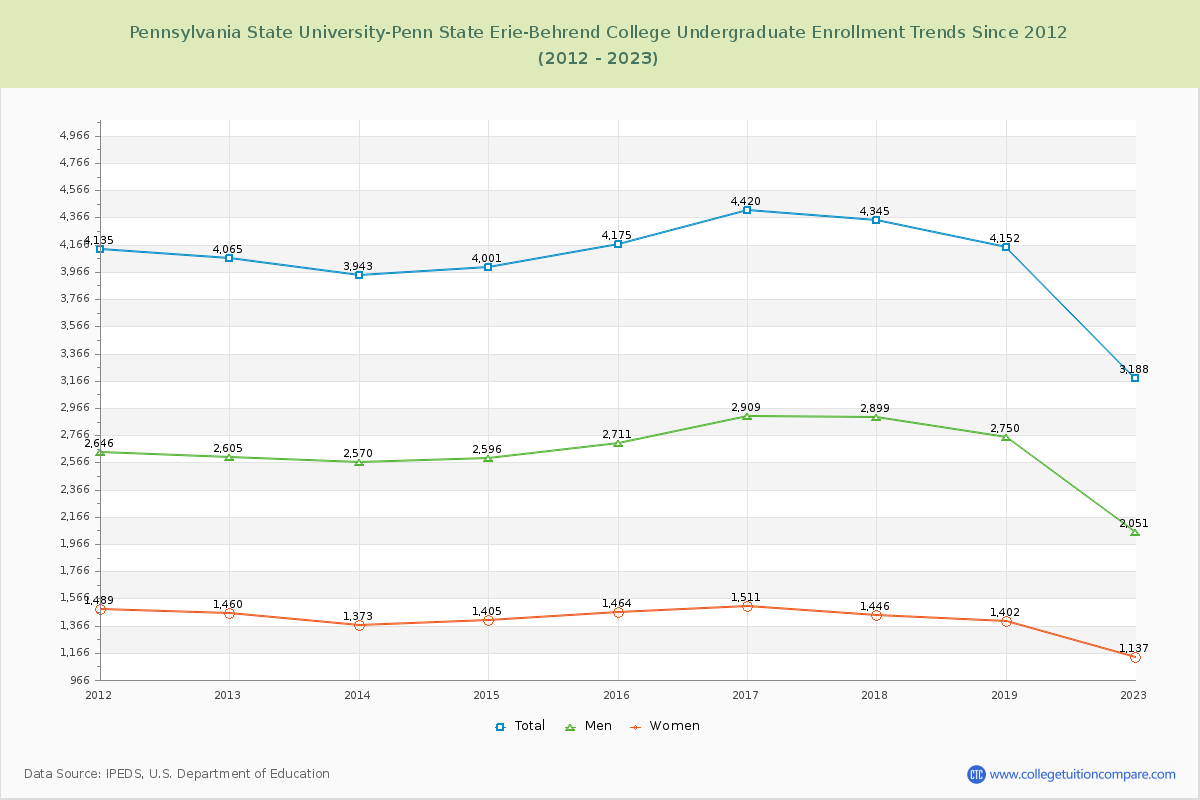
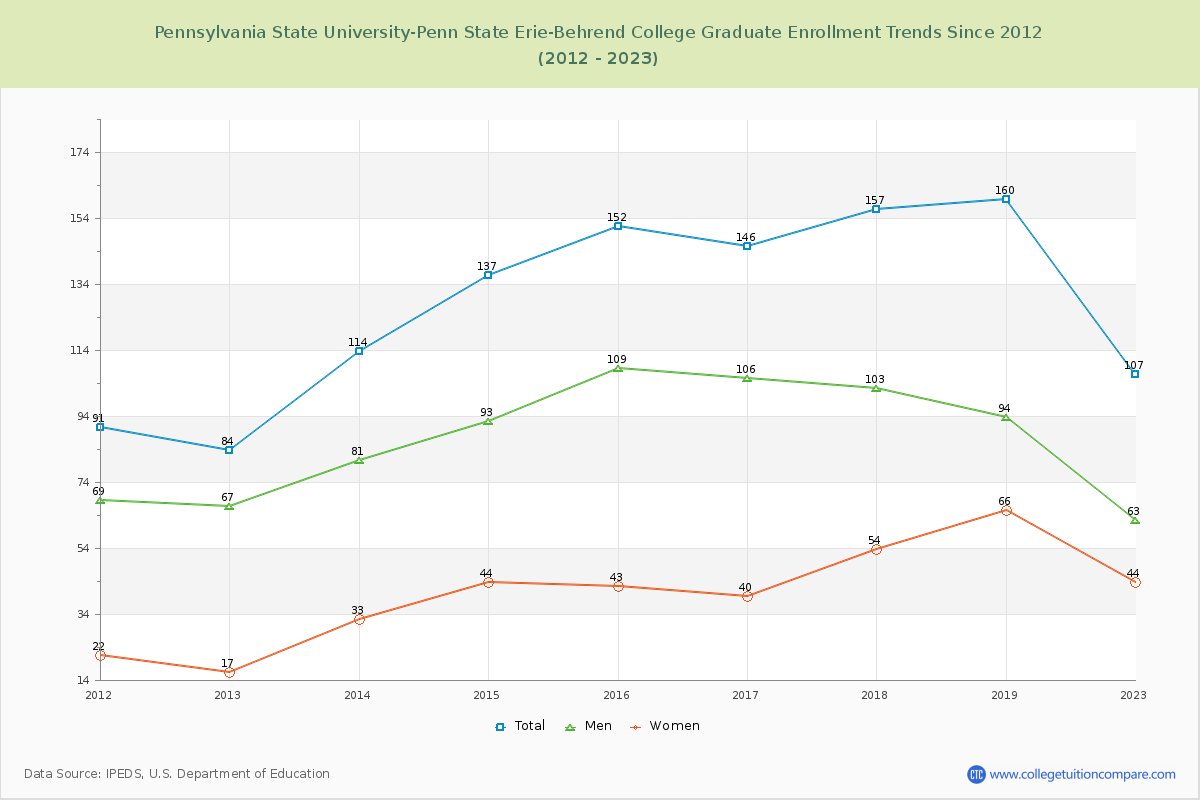
96.75% of total students is undergraduate students and 3.25% students is graduate students. The number of undergraduate students has decreased by 877 and the graduate enrollment has increased by 23 over past 10 years.
The female to male ratio is 0.56 to 1 and it means that there are more male students enrolled in Penn State Behrend than female students.
The following table and chart illustrate the changes in student population by gender at Pennsylvania State University-Penn State Erie-Behrend College since 2012.
| Year | Total | Undergraduate | Graduate | ||||
|---|---|---|---|---|---|---|---|
| Total | Men | Women | Total | Men | Women | ||
| 2012-13 | 4,149 | 4,065 | 2,605 | 1,460 | 84 | 67 | 17 |
| 2013-14 | 4,057 -92 | 3,943 -122 | 2,570 -35 | 1,373 -87 | 114 30 | 81 14 | 33 16 |
| 2014-15 | 4,138 81 | 4,001 58 | 2,596 26 | 1,405 32 | 137 23 | 93 12 | 44 11 |
| 2015-16 | 4,327 189 | 4,175 174 | 2,711 115 | 1,464 59 | 152 15 | 109 16 | 43 -1 |
| 2016-17 | 4,566 239 | 4,420 245 | 2,909 198 | 1,511 47 | 146 -6 | 106 -3 | 40 -3 |
| 2017-18 | 4,502 -64 | 4,345 -75 | 2,899 -10 | 1,446 -65 | 157 11 | 103 -3 | 54 14 |
| 2018-19 | 4,312 -190 | 4,152 -193 | 2,750 -149 | 1,402 -44 | 160 3 | 94 -9 | 66 12 |
| 2019-20 | 0 -4,312 | 0 -4,152 | 0 -2,750 | 0 -1,402 | 0 -160 | 0 -94 | 0 -66 |
| 2020-21 | 0 0 | 0 0 | 0 0 | 0 0 | 0 0 | 0 0 | 0 0 |
| 2021-22 | 0 0 | 0 0 | 0 0 | 0 0 | 0 0 | 0 0 | 0 0 |
| 2022-23 | 3,295 3,295 | 3,188 3,188 | 2,051 2,051 | 1,137 1,137 | 107 107 | 63 63 | 44 44 |
| Average | 3,031 | 2,935 | 1,917 | 1,018 | 96 | 65 | 31 |