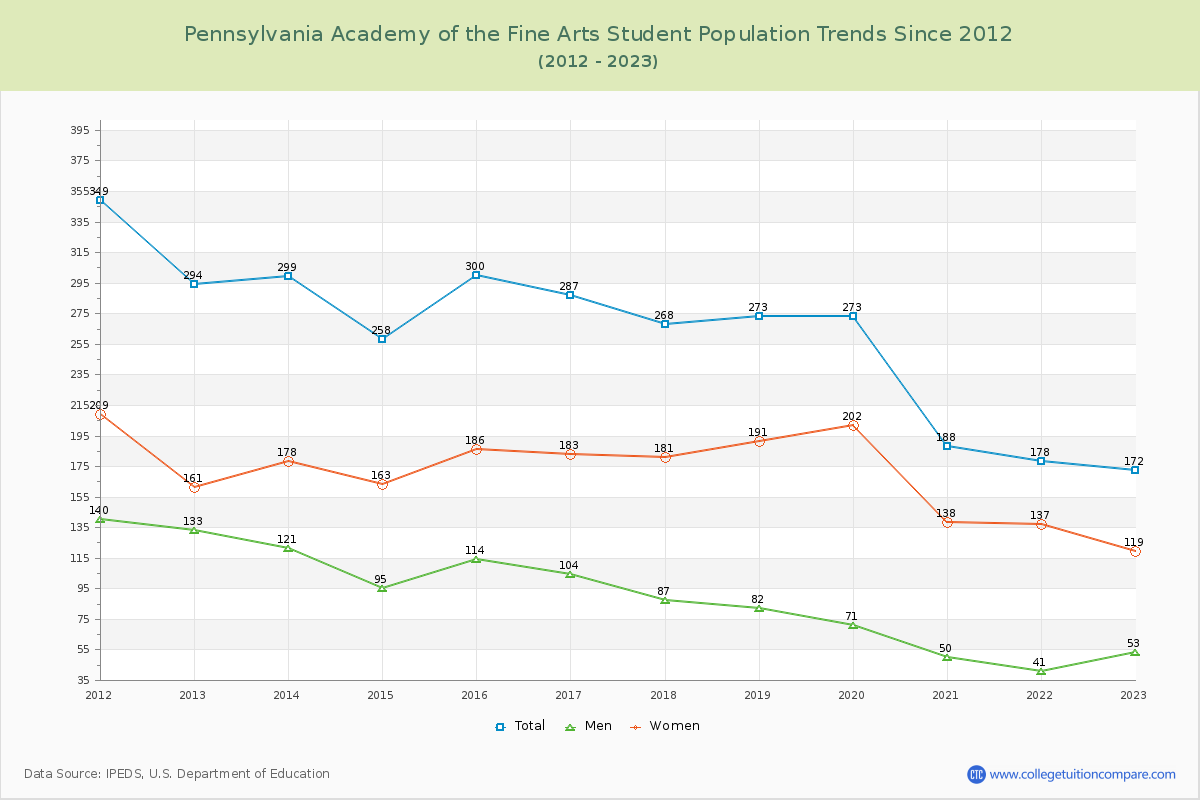
Student Population Changes
The average student population over the last 12 years is 254 where 172 students are attending the school for the academic year 2022-2023.
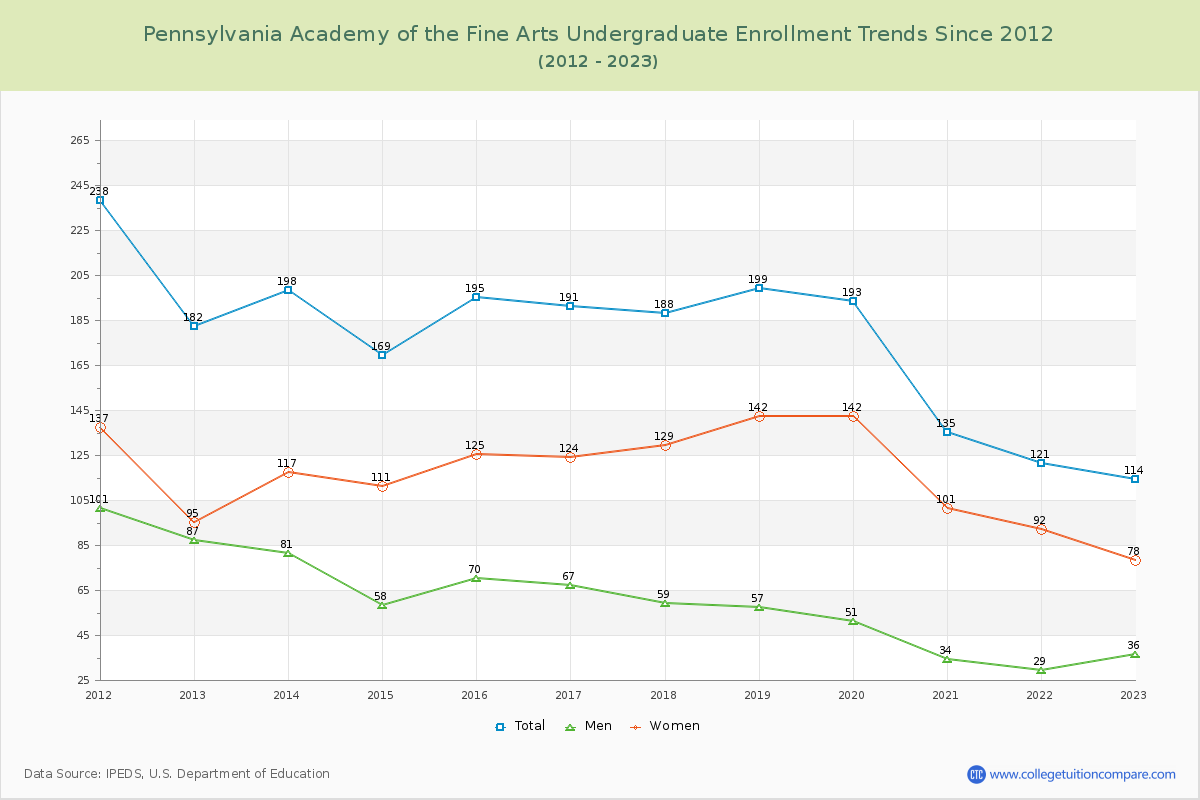
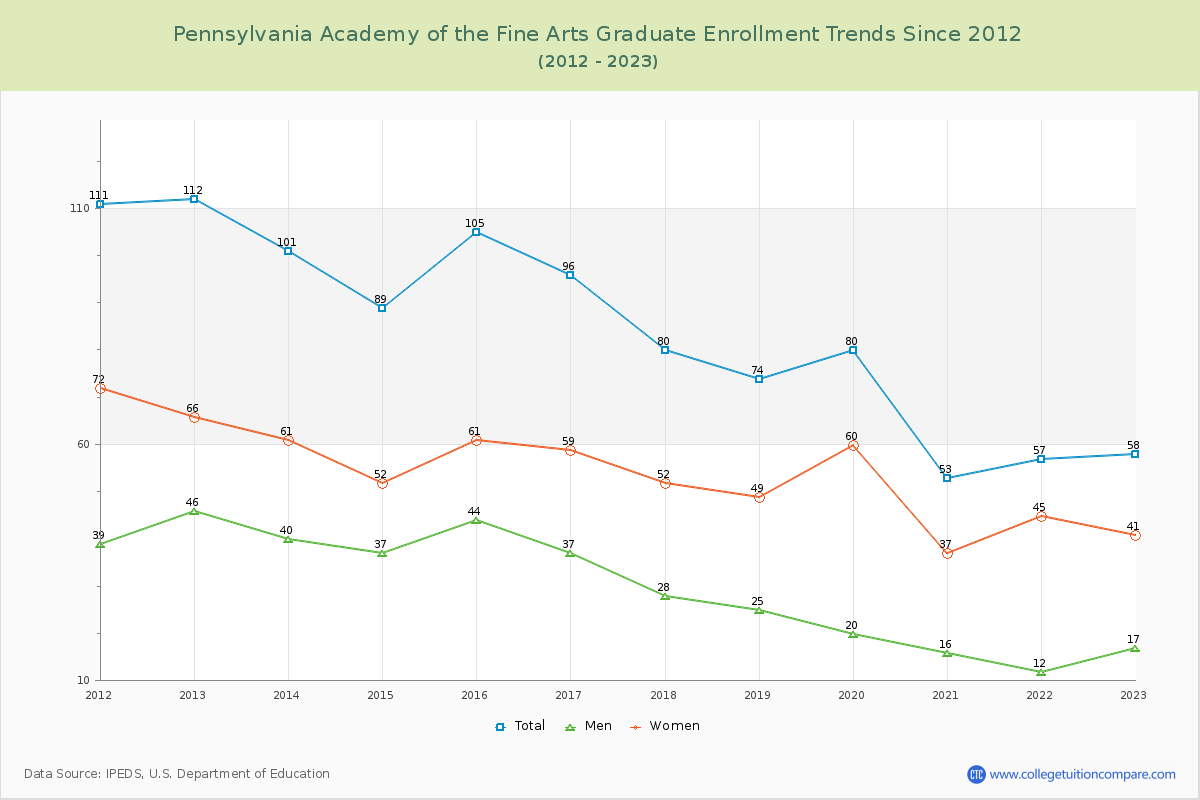
66.28% of total students is undergraduate students and 33.72% students is graduate students. The number of undergraduate students has decreased by 68 and the graduate enrollment has decreased by 54 over past 10 years.
The female to male ratio is 2.25 to 1 and it means that there are far more female students enrolled in PAFA than male students.
The following table and chart illustrate the changes in student population by gender at Pennsylvania Academy of the Fine Arts since 2012.
| Year | Total | Undergraduate | Graduate | ||||
|---|---|---|---|---|---|---|---|
| Total | Men | Women | Total | Men | Women | ||
| 2012-13 | 294 | 182 | 87 | 95 | 112 | 46 | 66 |
| 2013-14 | 299 5 | 198 16 | 81 -6 | 117 22 | 101 -11 | 40 -6 | 61 -5 |
| 2014-15 | 258 -41 | 169 -29 | 58 -23 | 111 -6 | 89 -12 | 37 -3 | 52 -9 |
| 2015-16 | 300 42 | 195 26 | 70 12 | 125 14 | 105 16 | 44 7 | 61 9 |
| 2016-17 | 287 -13 | 191 -4 | 67 -3 | 124 -1 | 96 -9 | 37 -7 | 59 -2 |
| 2017-18 | 268 -19 | 188 -3 | 59 -8 | 129 5 | 80 -16 | 28 -9 | 52 -7 |
| 2018-19 | 273 5 | 199 11 | 57 -2 | 142 13 | 74 -6 | 25 -3 | 49 -3 |
| 2019-20 | 273 0 | 193 -6 | 51 -6 | 142 0 | 80 6 | 20 -5 | 60 11 |
| 2020-21 | 188 -85 | 135 -58 | 34 -17 | 101 -41 | 53 -27 | 16 -4 | 37 -23 |
| 2021-22 | 178 -10 | 121 -14 | 29 -5 | 92 -9 | 57 4 | 12 -4 | 45 8 |
| 2022-23 | 172 -6 | 114 -7 | 36 7 | 78 -14 | 58 1 | 17 5 | 41 -4 |
| Average | 254 | 171 | 57 | 114 | 82 | 29 | 53 |