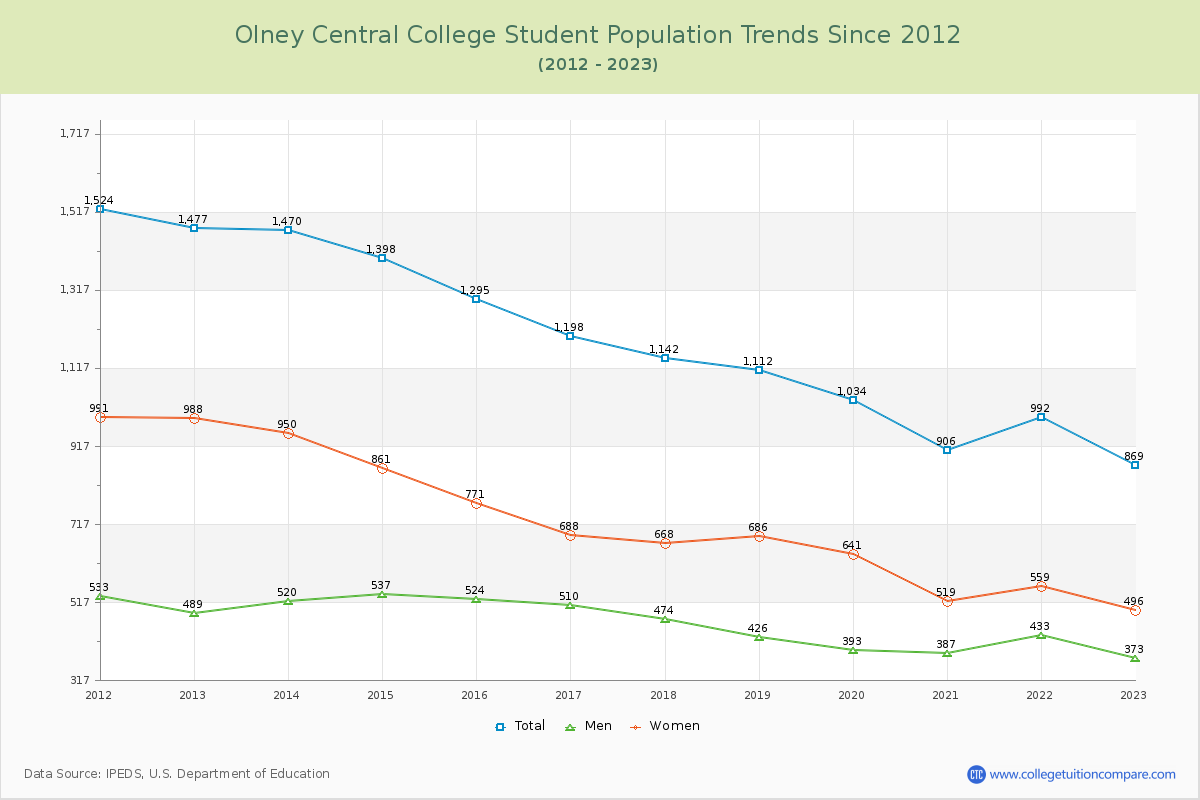
Student Population Changes
The average student population over the last 12 years is 1,172 where 869 students are attending the school for the academic year 2022-2023.
The female to male ratio is 1.33 to 1 and it means that there are more female students enrolled in Olney Central than male students.
The following table and chart illustrate the changes in student population by gender at Olney Central College since 2012.
| Year | Total | Men | Women |
|---|---|---|---|
| 2012-13 | 1,477 | 489 | 988 |
| 2013-14 | 1,470 -7 | 520 31 | 950 -38 |
| 2014-15 | 1,398 -72 | 537 17 | 861 -89 |
| 2015-16 | 1,295 -103 | 524 -13 | 771 -90 |
| 2016-17 | 1,198 -97 | 510 -14 | 688 -83 |
| 2017-18 | 1,142 -56 | 474 -36 | 668 -20 |
| 2018-19 | 1,112 -30 | 426 -48 | 686 18 |
| 2019-20 | 1,034 -78 | 393 -33 | 641 -45 |
| 2020-21 | 906 -128 | 387 -6 | 519 -122 |
| 2021-22 | 992 86 | 433 46 | 559 40 |
| 2022-23 | 869 -123 | 373 -60 | 496 -63 |
| Average | 1,172 | 461 | 712 |