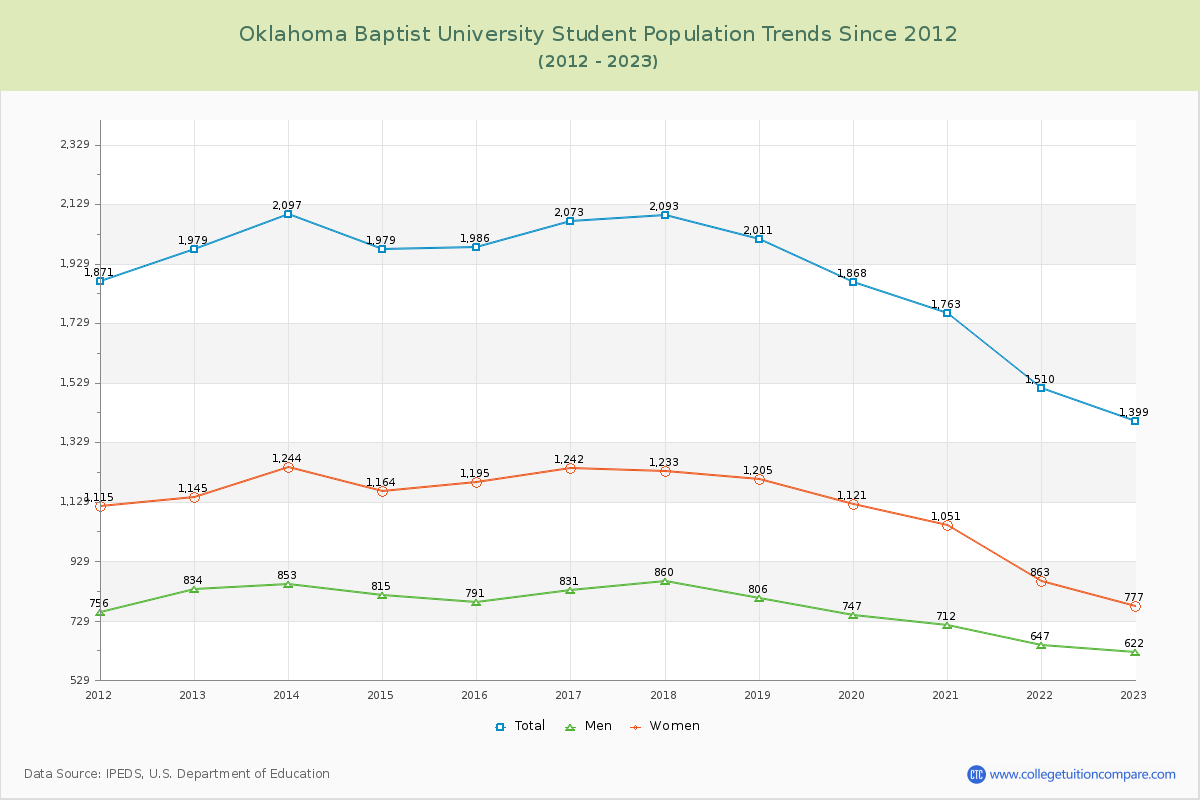
Student Population Changes
The average student population over the last 12 years is 1,887 where 1,399 students are attending the school for the academic year 2022-2023.
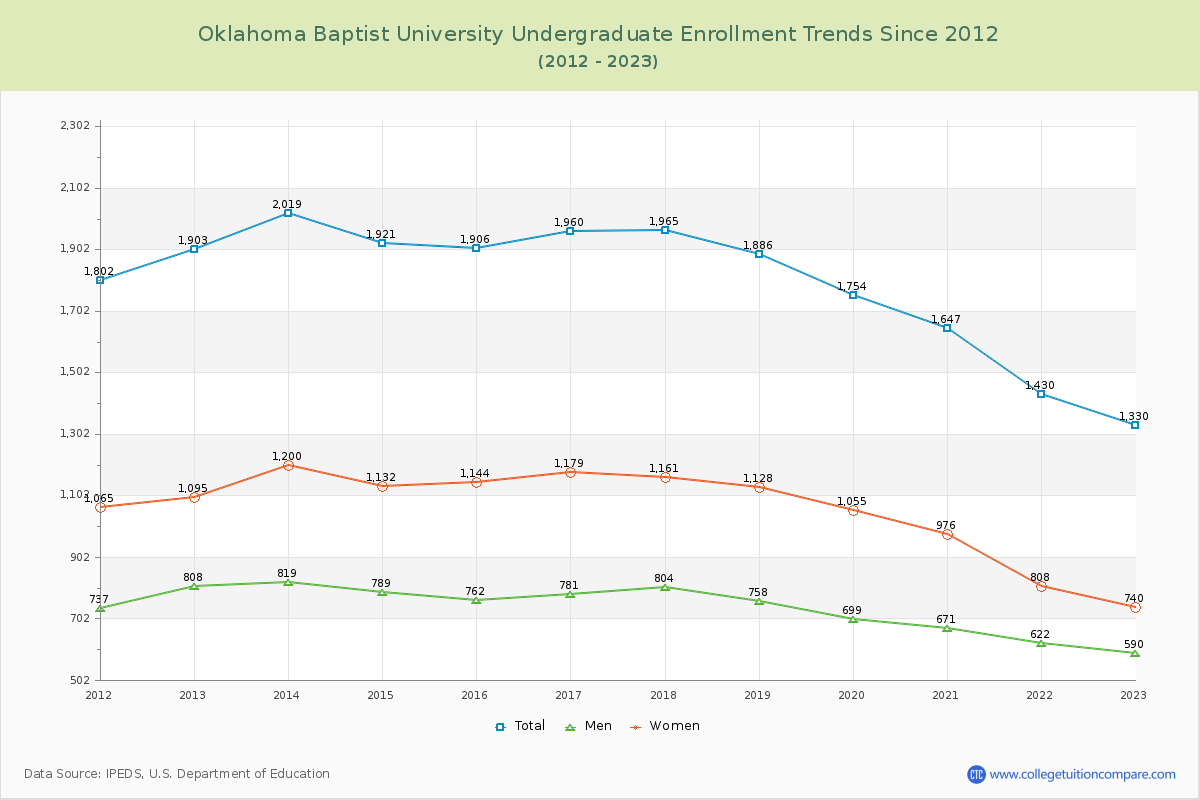
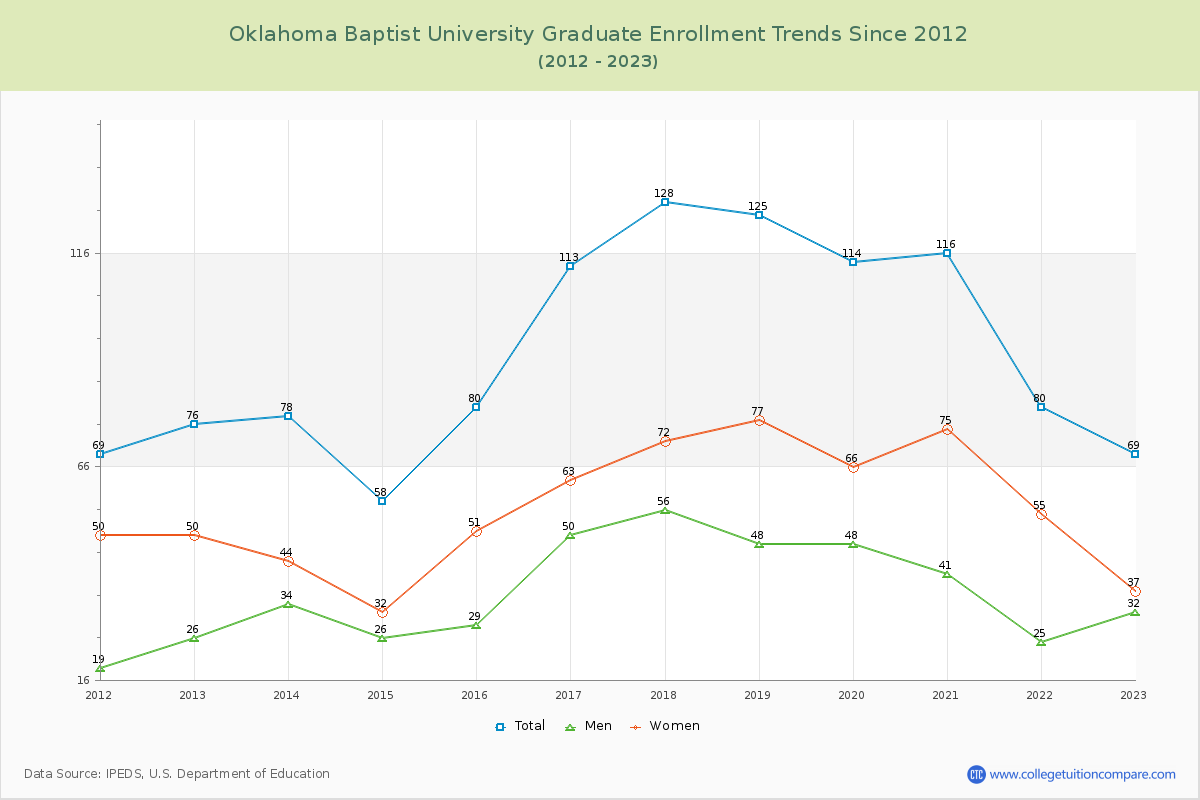
95.07% of total students is undergraduate students and 4.93% students is graduate students. The number of undergraduate students has decreased by 573 and the graduate enrollment has decreased by 7 over past 10 years.
The female to male ratio is 1.25 to 1 and it means that there are slightly more female students enrolled in Oklahoma Baptist than male students.
The following table and chart illustrate the changes in student population by gender at Oklahoma Baptist University since 2012.
| Year | Total | Undergraduate | Graduate | ||||
|---|---|---|---|---|---|---|---|
| Total | Men | Women | Total | Men | Women | ||
| 2012-13 | 1,979 | 1,903 | 808 | 1,095 | 76 | 26 | 50 |
| 2013-14 | 2,097 118 | 2,019 116 | 819 11 | 1,200 105 | 78 2 | 34 8 | 44 -6 |
| 2014-15 | 1,979 -118 | 1,921 -98 | 789 -30 | 1,132 -68 | 58 -20 | 26 -8 | 32 -12 |
| 2015-16 | 1,986 7 | 1,906 -15 | 762 -27 | 1,144 12 | 80 22 | 29 3 | 51 19 |
| 2016-17 | 2,073 87 | 1,960 54 | 781 19 | 1,179 35 | 113 33 | 50 21 | 63 12 |
| 2017-18 | 2,093 20 | 1,965 5 | 804 23 | 1,161 -18 | 128 15 | 56 6 | 72 9 |
| 2018-19 | 2,011 -82 | 1,886 -79 | 758 -46 | 1,128 -33 | 125 -3 | 48 -8 | 77 5 |
| 2019-20 | 1,868 -143 | 1,754 -132 | 699 -59 | 1,055 -73 | 114 -11 | 48 0 | 66 -11 |
| 2020-21 | 1,763 -105 | 1,647 -107 | 671 -28 | 976 -79 | 116 2 | 41 -7 | 75 9 |
| 2021-22 | 1,510 -253 | 1,430 -217 | 622 -49 | 808 -168 | 80 -36 | 25 -16 | 55 -20 |
| 2022-23 | 1,399 -111 | 1,330 -100 | 590 -32 | 740 -68 | 69 -11 | 32 7 | 37 -18 |
| Average | 1,887 | 1,793 | 737 | 1,056 | 94 | 38 | 57 |