Enrollment Trends at OCU

-2,859

Total Enrollment

-1,021

Men

-1,838

Women

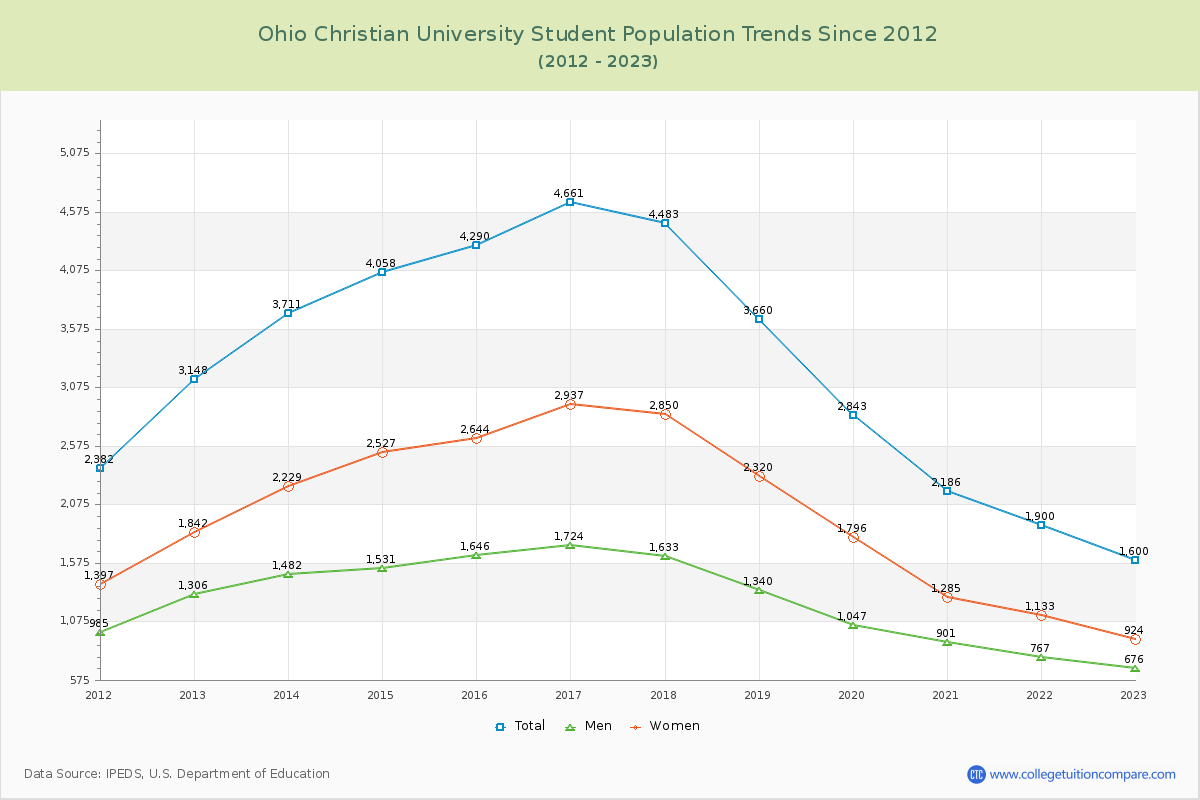
The student population at Ohio Christian University is 1,431 (1,288 undergraduate and 143 graduate students) . The number of students has decreased by 2,859 over the past decade.

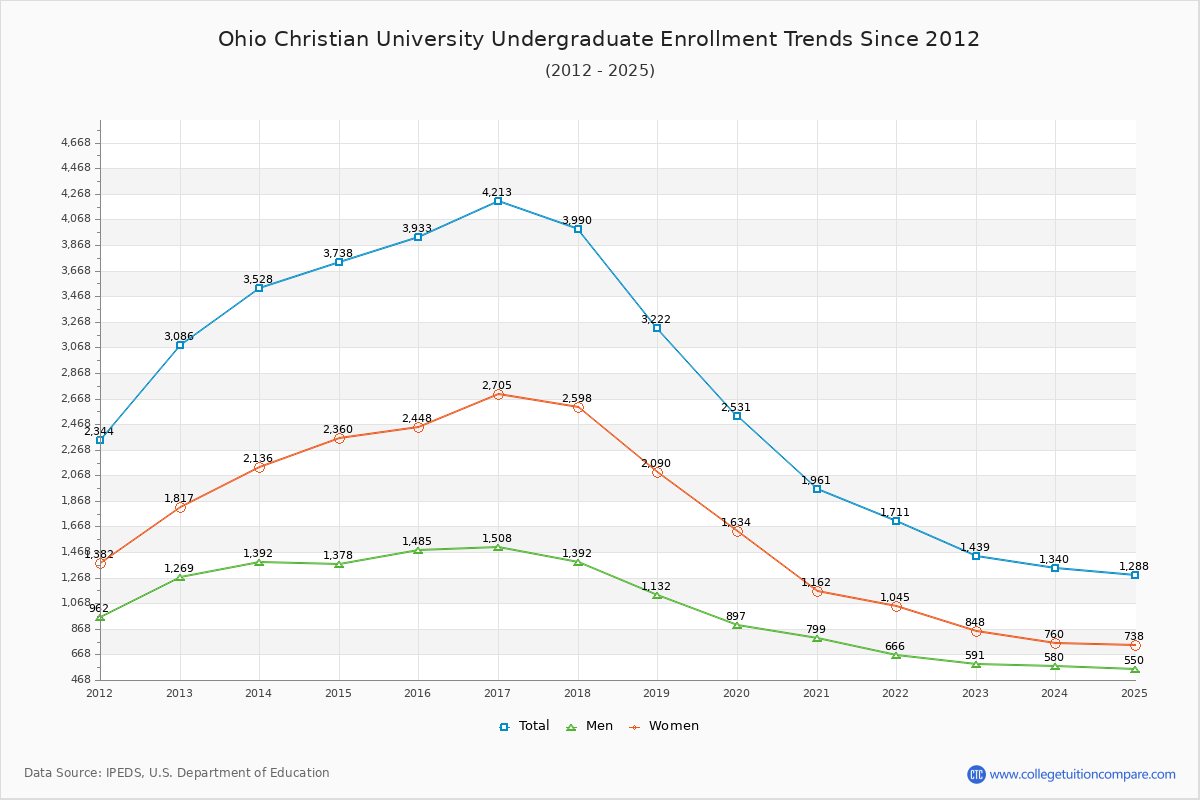
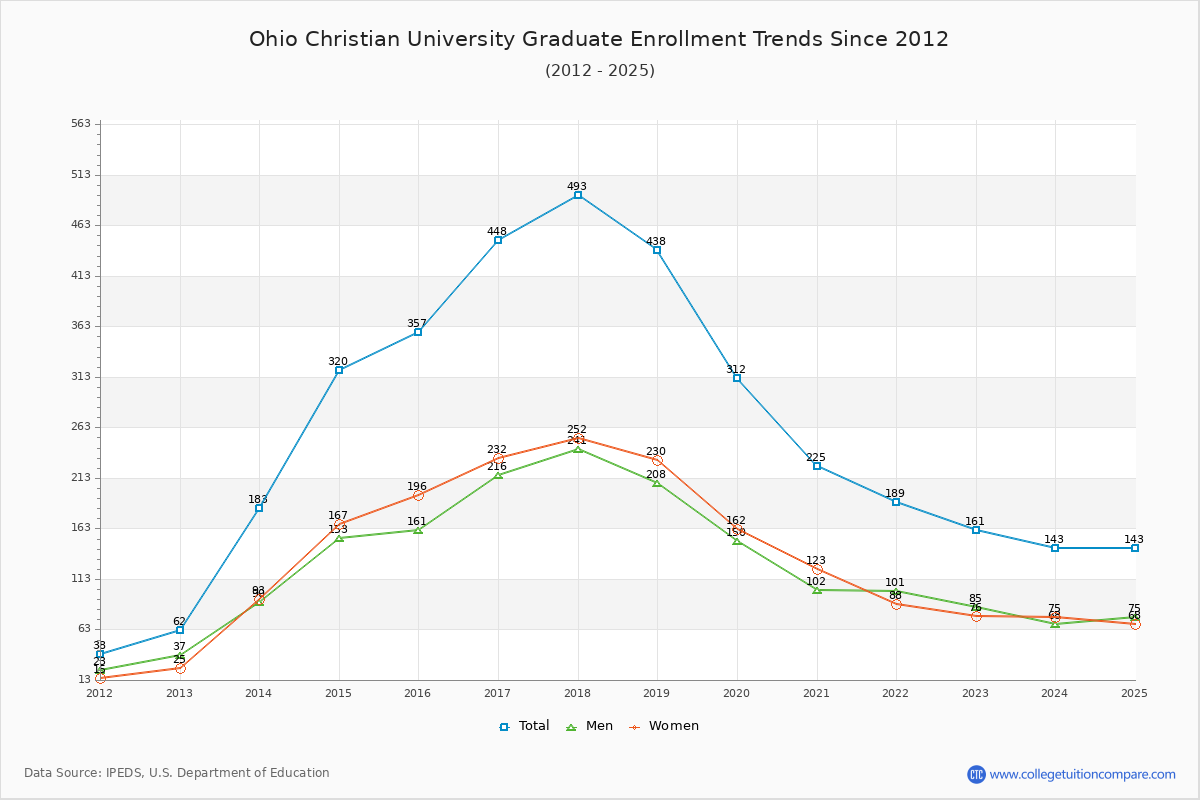
The percentage of undergraduate students at OCU is 90.01% which is decreased by 2,645 over last 10 years. The graduate student population decreased by 214 and it has been decreasing.

The female to male ratio is 1.29 to 1 which means that female students enrolled slightly more than male students.

884 students enrolled in online degree program exclusively and the number of online students has decreased by -64.04% since 2015.

Student Population Changes

The average student population over the last 11 years is 2,854 where 1,431 students are attending the school for the academic year 2024-2025.

90.01% of total students is undergraduate students and 9.99% students is graduate students. The number of undergraduate students has decreased by 2,645 and the graduate enrollment has decreased by 214 over past 10 years.

The female to male ratio is 1.29 to 1 and it means that there are slightly more female students enrolled in OCU than male students.

The following table and chart illustrate the changes in student population by gender at Ohio Christian University since 2015.

YearTotalUndergraduateGraduate
TotalMenWomenTotalMenWomen
2015-164,2903,9331,4852,448357161196
2016-174,661
371
4,213
280
1,508
23
2,705
257
448
91
216
55
232
36
2017-184,483
-178
3,990
-223
1,392
-116
2,598
-107
493
45
241
25
252
20
2018-193,660
-823
3,222
-768
1,132
-260
2,090
-508
438
-55
208
-33
230
-22
2019-202,843
-817
2,531
-691
897
-235
1,634
-456
312
-126
150
-58
162
-68
2020-212,186
-657
1,961
-570
799
-98
1,162
-472
225
-87
102
-48
123
-39
2021-221,900
-286
1,711
-250
666
-133
1,045
-117
189
-36
101
-1
88
-35
2022-231,600
-300
1,439
-272
591
-75
848
-197
161
-28
85
-16
76
-12
2023-241,483
-117
1,340
-99
580
-11
760
-88
143
-18
68
-17
75
-1
2024-251,431
-52
1,288
-52
550
-30
738
-22
14375
7
68
-7
Average2,8542,5639601,603291141150
Ohio Christian University Enrollment Trends Chart

Undergraduate Enrollment Changes

The average number of Undergraduate students over the last 11 years is 2,563 where 1,288 students are attending the Undergraduate school for the academic year 2024-2025. The following table and chart illustrate the changes in Undergraduate enrollment by attending status and gender at Ohio Christian University since 2015.

YearTotalFull-timePart-time
TotalMenWomenTotalMenWomen
2015-163,9332,4859031,5821,448582866
2016-174,2132,4818731,6081,7326351,097
2017-183,9902,4298391,5901,5615531,008
2018-193,2222,0877381,3491,135394741
2019-202,5311,6275841,043904313591
2020-211,9611,034425609927374553
2021-221,711860376484851290561
2022-231,439668295373771296475
2023-241,340566247319774333441
2024-251,288620273347668277391
Average2,5632,5635559302,563405672
Ohio Christian University Undergraduate Enrollment Trends Chart

Graduate Enrollment Changes

The average number of Graduate students over the last 11 years is 291 where 143 students are attending the Graduate school for the academic year 2024-2025. The following table and chart illustrate the changes in Graduate enrollment by attending status and gender at Ohio Christian University since 2015.

YearTotalFull-timePart-time
TotalMenWomenTotalMenWomen
2015-16357290134156672740
2016-174483161521641326468
2017-18493401194207924745
2018-19438361175186773344
2019-20312234112122783840
2020-212251557283703040
2021-221891427765472423
2022-231611236657381919
2023-241431035152401723
2024-251431065749371819
Average2912911091142913236
Ohio Christian University Graduate Enrollment Trends Chart

Enrollment by Race/Ethnicity Changes

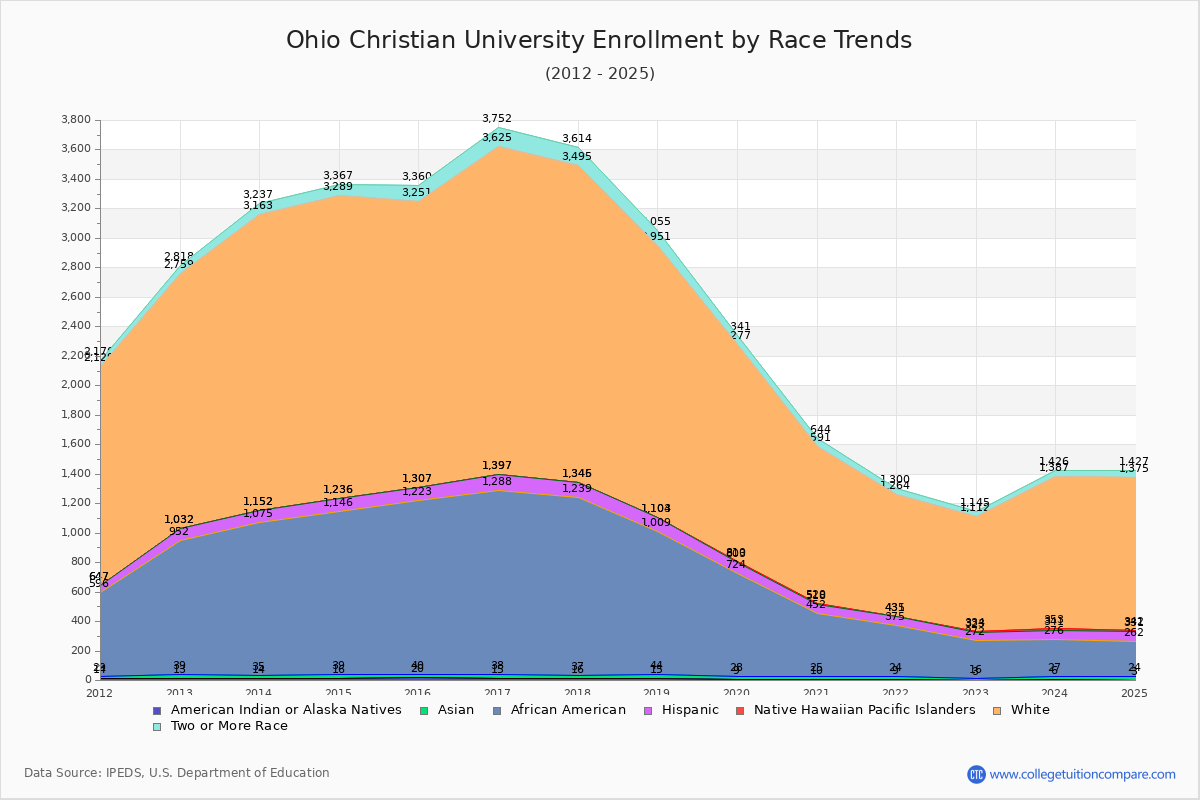
The percentage of white students is 72.19%. The percentage was 45.31% 10 years ago and OCU still has a high percentage of white students. 1.47% of enrolled students is Asian and 16.63% is black students. Hispanic students comprise 4.82% of the student body.

Over the past 10 years, the racial composition has shifted. The percentage of white students increased from 45.31% to 72.19%. Asian enrollment grew from 0.47% to 1.47%. Black student enrollment decreased from 27.58% to 16.63%. Hispanic student representation expanded from 1.96% to 4.82%.

The overall racial diversity, measured by the Census Bureau Diversity Index, is 0.4473 which indicates that somewhat diverse. This decreased from 0.7175 a decade ago, suggesting that racial diversity has declined.

The following table and chart illustrate the student population trends by race/ethnicity at Ohio Christian University over the past 11 years (2015-2025).

YearAmerican Indian or Native AmericanAsianBlackHispanicNative Hawaiian or Other Pacific IslanderWhiteTwo or More Races
2015-1620201,1838401,944109
2016-1715231,25010902,228127
2017-1816211,20210612,149119
2018-1915299659411,847104
2019-209196967971,46764
2020-2110154276621,07153
2021-2291535156482936
2022-23313256511177833
2023-2462124965121,03439
2024-2532123869111,03352
Average11206827851,43874
Ohio Christian University Enrollment by Race Trends Chart

Distance Learning (Online Courses) Enrollment Changes

884 students are enrolled in online degree programs exclusively for the academic year 2024-2025, which is 62% of total students. The number of online students has decreased -64.04% since 2015. The following table and chart illustrate the changes in the online student population by enrolled type at Ohio Christian University from 2015 to 2025.

YearTotal EnrollmentOnline CompletelyEnrolled in Some Online CoursesNot Enrolled in Online Courses
2015-164,2902,458371,795
2016-174,6612,9861,129546
2017-184,4832,5841,483416
2018-193,6602,0361,166458
2019-202,8431,510879454
2020-212,1861,5470639
2021-221,9001,5430357
2022-231,6001,28782231
2023-241,4839010582
2024-251,431884107440
Average2,8541,774488592

Ratings & Review

Share your experiences and thoughts about Ohio Christian University. It will be a great help to applicants and prospective students!