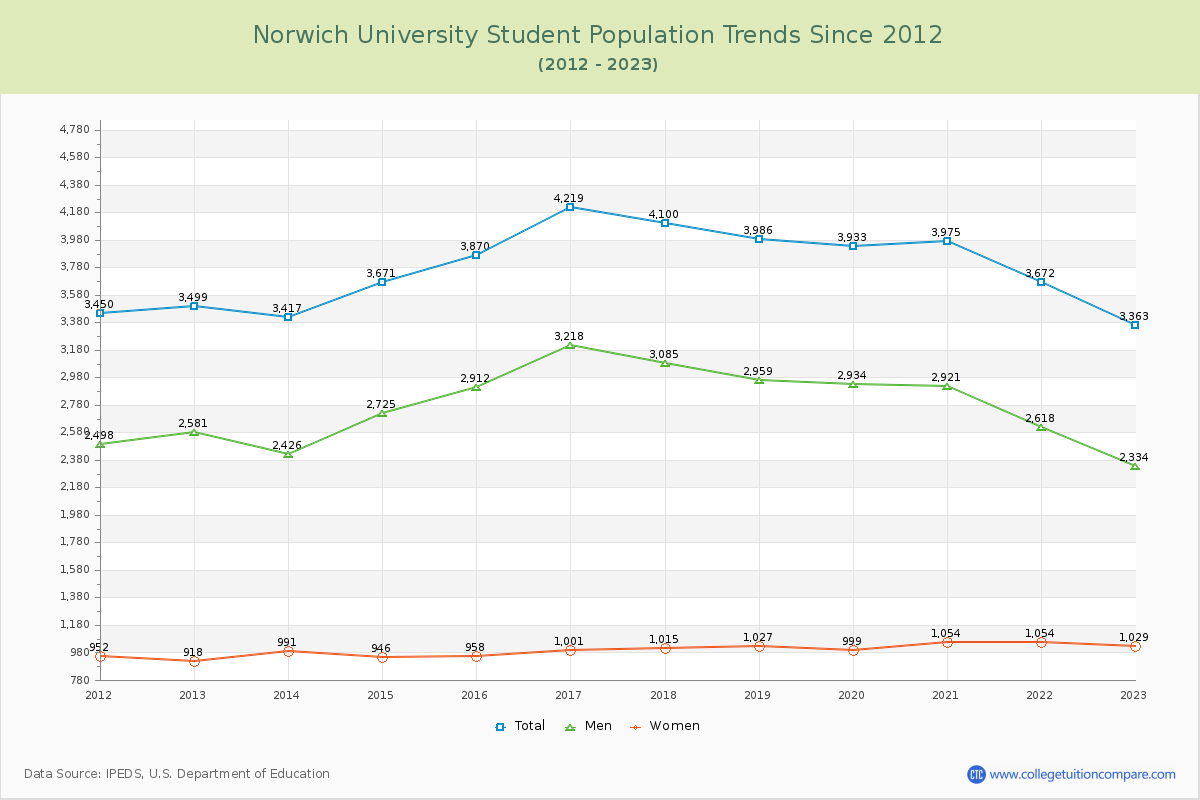
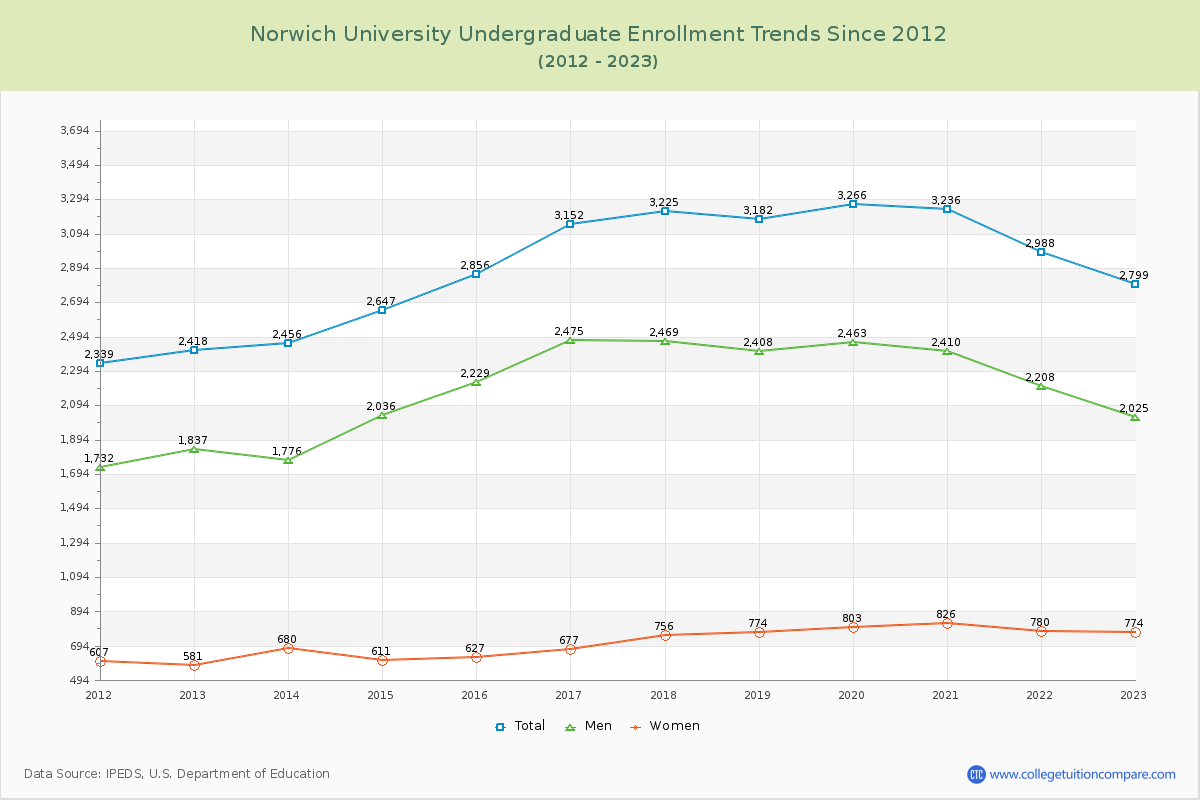
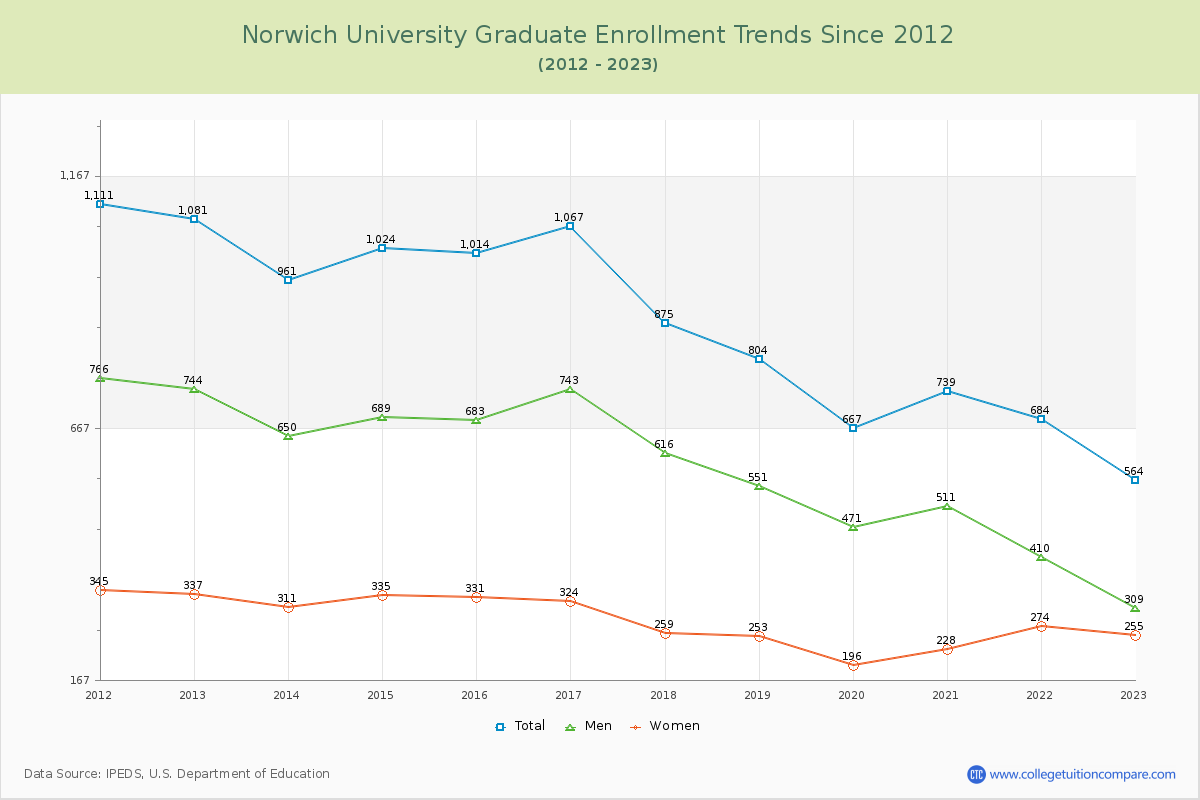
Student Population Changes
The average student population over the last 12 years is 3,791 where 3,363 students are attending the school for the academic year 2022-2023.
83.23% of total students is undergraduate students and 16.77% students is graduate students. The number of undergraduate students has increased by 381 and the graduate enrollment has decreased by 517 over past 10 years.
The female to male ratio is 0.44 to 1 and it means that there are far more male students enrolled in Norwich than female students.
The following table and chart illustrate the changes in student population by gender at Norwich University since 2012.
| Year | Total | Undergraduate | Graduate | ||||
|---|---|---|---|---|---|---|---|
| Total | Men | Women | Total | Men | Women | ||
| 2012-13 | 3,499 | 2,418 | 1,837 | 581 | 1,081 | 744 | 337 |
| 2013-14 | 3,417 -82 | 2,456 38 | 1,776 -61 | 680 99 | 961 -120 | 650 -94 | 311 -26 |
| 2014-15 | 3,671 254 | 2,647 191 | 2,036 260 | 611 -69 | 1,024 63 | 689 39 | 335 24 |
| 2015-16 | 3,870 199 | 2,856 209 | 2,229 193 | 627 16 | 1,014 -10 | 683 -6 | 331 -4 |
| 2016-17 | 4,219 349 | 3,152 296 | 2,475 246 | 677 50 | 1,067 53 | 743 60 | 324 -7 |
| 2017-18 | 4,100 -119 | 3,225 73 | 2,469 -6 | 756 79 | 875 -192 | 616 -127 | 259 -65 |
| 2018-19 | 3,986 -114 | 3,182 -43 | 2,408 -61 | 774 18 | 804 -71 | 551 -65 | 253 -6 |
| 2019-20 | 3,933 -53 | 3,266 84 | 2,463 55 | 803 29 | 667 -137 | 471 -80 | 196 -57 |
| 2020-21 | 3,975 42 | 3,236 -30 | 2,410 -53 | 826 23 | 739 72 | 511 40 | 228 32 |
| 2021-22 | 3,672 -303 | 2,988 -248 | 2,208 -202 | 780 -46 | 684 -55 | 410 -101 | 274 46 |
| 2022-23 | 3,363 -309 | 2,799 -189 | 2,025 -183 | 774 -6 | 564 -120 | 309 -101 | 255 -19 |
| Average | 3,791 | 2,930 | 2,212 | 717 | 862 | 580 | 282 |