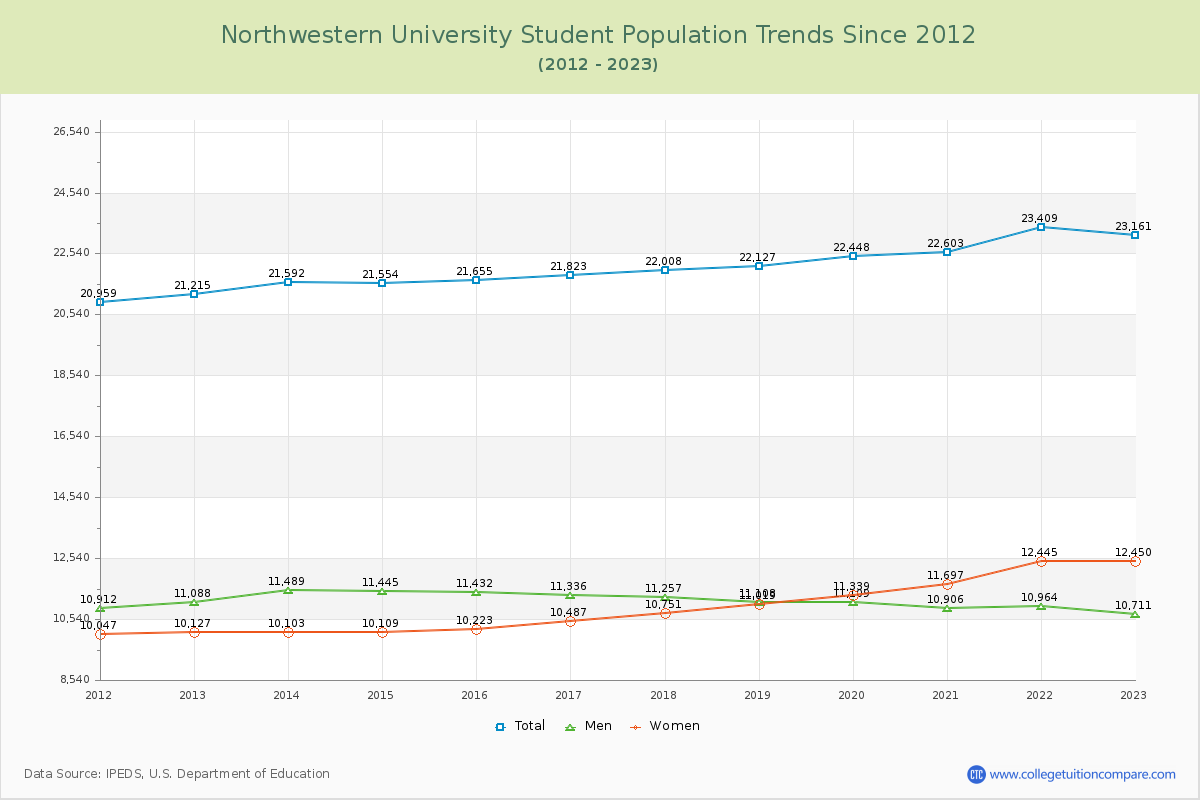
Student Population Changes
The average student population over the last 12 years is 22,145 where 23,161 students are attending the school for the academic year 2022-2023.
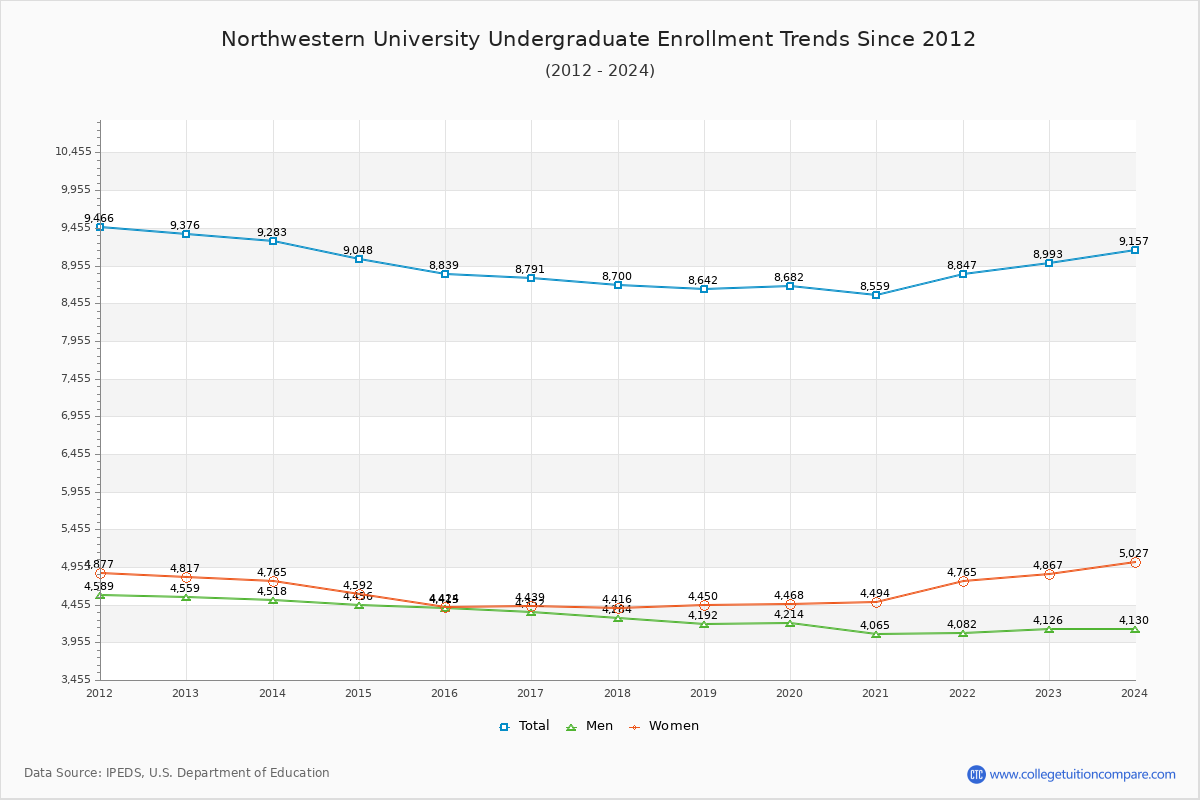
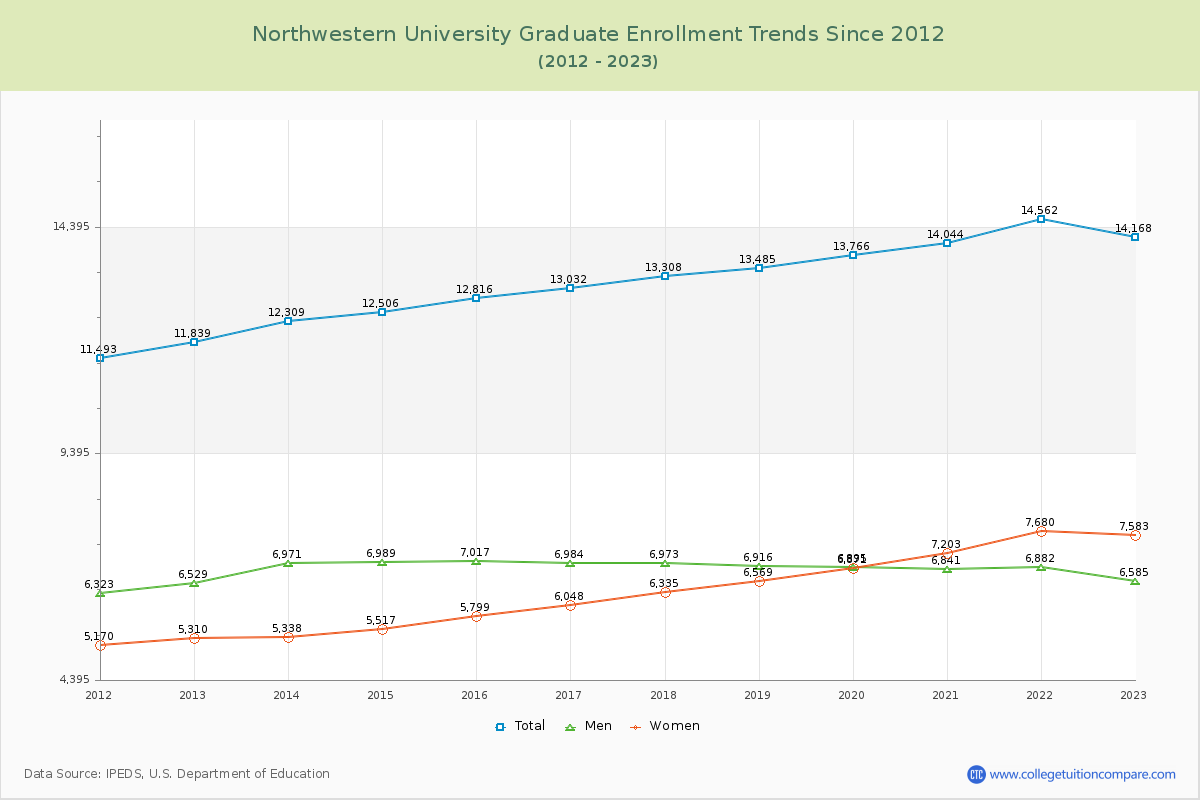
38.83% of total students is undergraduate students and 61.17% students is graduate students. The number of undergraduate students has decreased by 383 and the graduate enrollment has increased by 2,329 over past 10 years.
The female to male ratio is 1.16 to 1 and it means that there are slightly more female students enrolled in Northwestern than male students.
The following table and chart illustrate the changes in student population by gender at Northwestern University since 2012.
| Year | Total | Undergraduate | Graduate | ||||
|---|---|---|---|---|---|---|---|
| Total | Men | Women | Total | Men | Women | ||
| 2012-13 | 21,215 | 9,376 | 4,559 | 4,817 | 11,839 | 6,529 | 5,310 |
| 2013-14 | 21,592 377 | 9,283 -93 | 4,518 -41 | 4,765 -52 | 12,309 470 | 6,971 442 | 5,338 28 |
| 2014-15 | 21,554 -38 | 9,048 -235 | 4,456 -62 | 4,592 -173 | 12,506 197 | 6,989 18 | 5,517 179 |
| 2015-16 | 21,655 101 | 8,839 -209 | 4,415 -41 | 4,424 -168 | 12,816 310 | 7,017 28 | 5,799 282 |
| 2016-17 | 21,823 168 | 8,791 -48 | 4,352 -63 | 4,439 15 | 13,032 216 | 6,984 -33 | 6,048 249 |
| 2017-18 | 22,008 185 | 8,700 -91 | 4,284 -68 | 4,416 -23 | 13,308 276 | 6,973 -11 | 6,335 287 |
| 2018-19 | 22,127 119 | 8,642 -58 | 4,192 -92 | 4,450 34 | 13,485 177 | 6,916 -57 | 6,569 234 |
| 2019-20 | 22,448 321 | 8,682 40 | 4,214 22 | 4,468 18 | 13,766 281 | 6,895 -21 | 6,871 302 |
| 2020-21 | 22,603 155 | 8,559 -123 | 4,065 -149 | 4,494 26 | 14,044 278 | 6,841 -54 | 7,203 332 |
| 2021-22 | 23,409 806 | 8,847 288 | 4,082 17 | 4,765 271 | 14,562 518 | 6,882 41 | 7,680 477 |
| 2022-23 | 23,161 -248 | 8,993 146 | 4,126 44 | 4,867 102 | 14,168 -394 | 6,585 -297 | 7,583 -97 |
| Average | 22,145 | 8,887 | 4,297 | 4,591 | 13,258 | 6,871 | 6,387 |