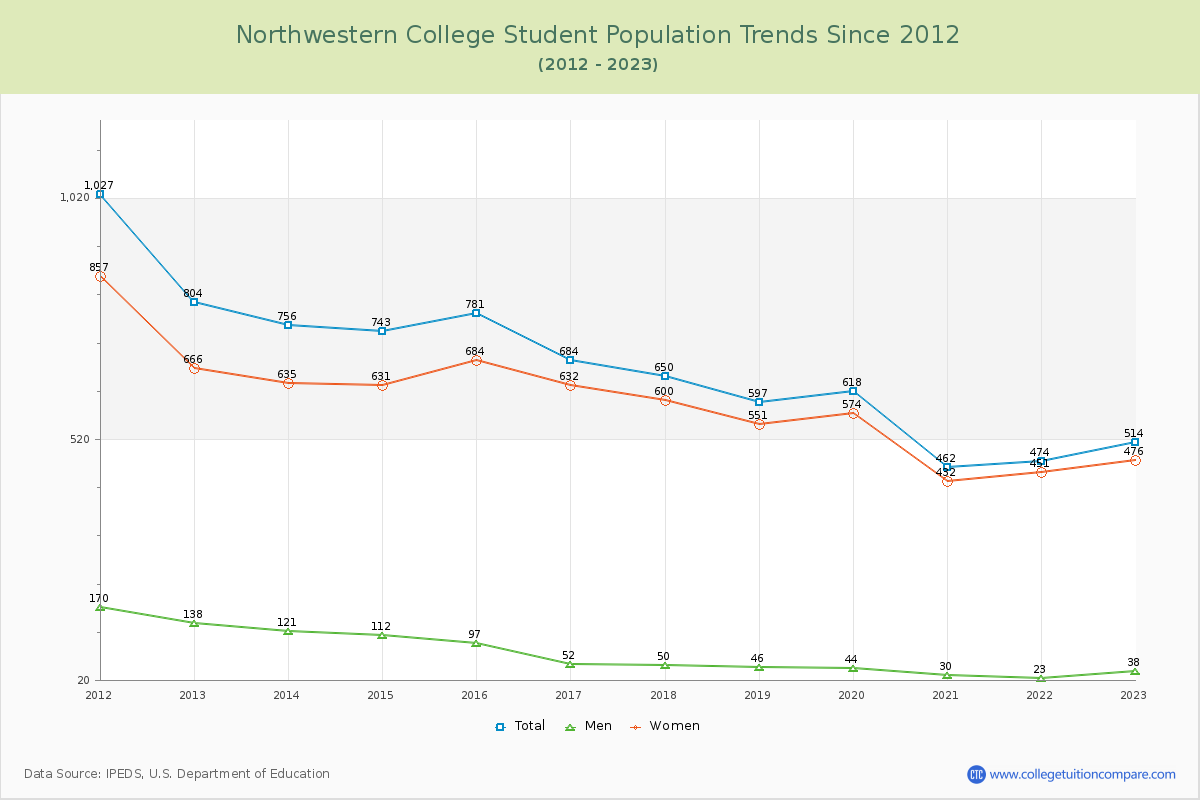
Student Population Changes
The average student population over the last 12 years is 644 where 514 students are attending the school for the academic year 2022-2023.
The female to male ratio is 12.53 to 1 and it means that there are far more female students enrolled in NWBC than male students.
The following table and chart illustrate the changes in student population by gender at Northwestern College since 2012.
| Year | Total | Men | Women |
|---|---|---|---|
| 2012-13 | 804 | 138 | 666 |
| 2013-14 | 756 -48 | 121 -17 | 635 -31 |
| 2014-15 | 743 -13 | 112 -9 | 631 -4 |
| 2015-16 | 781 38 | 97 -15 | 684 53 |
| 2016-17 | 684 -97 | 52 -45 | 632 -52 |
| 2017-18 | 650 -34 | 50 -2 | 600 -32 |
| 2018-19 | 597 -53 | 46 -4 | 551 -49 |
| 2019-20 | 618 21 | 44 -2 | 574 23 |
| 2020-21 | 462 -156 | 30 -14 | 432 -142 |
| 2021-22 | 474 12 | 23 -7 | 451 19 |
| 2022-23 | 514 40 | 38 15 | 476 25 |
| Average | 644 | 68 | 576 |