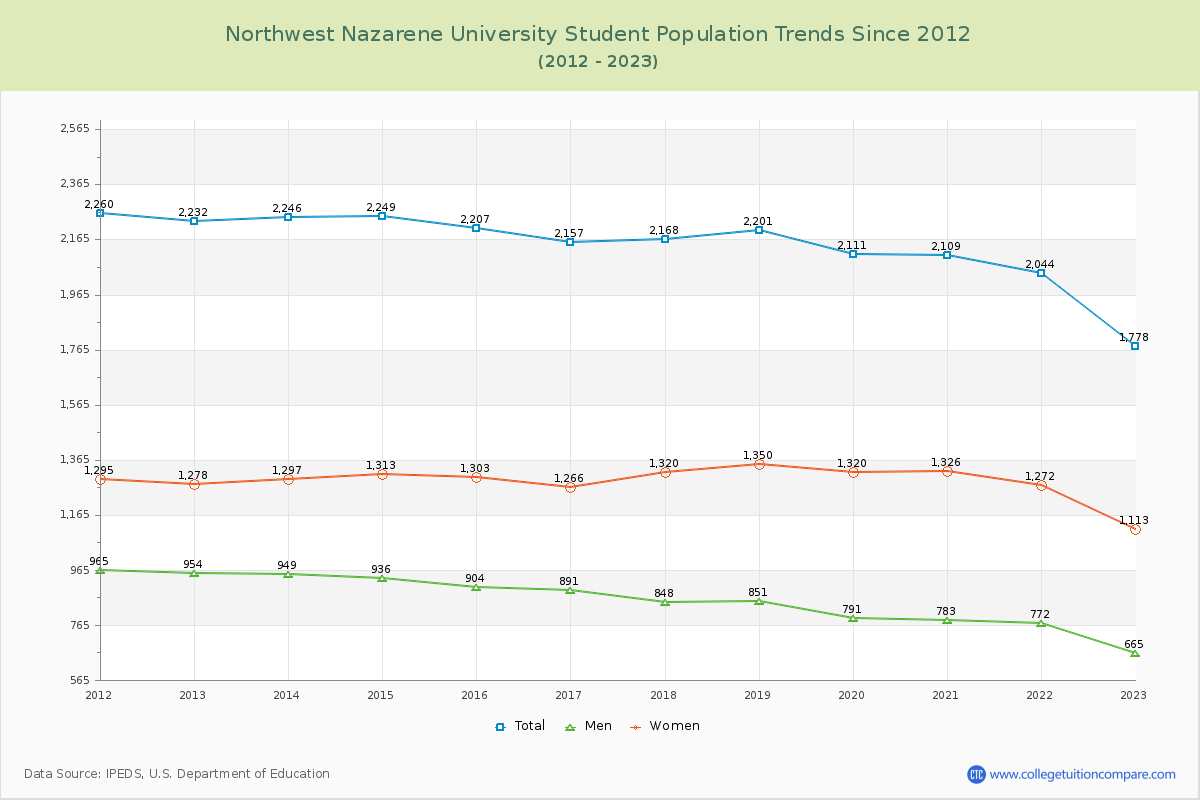
Student Population Changes
The average student population over the last 12 years is 2,137 where 1,778 students are attending the school for the academic year 2022-2023.
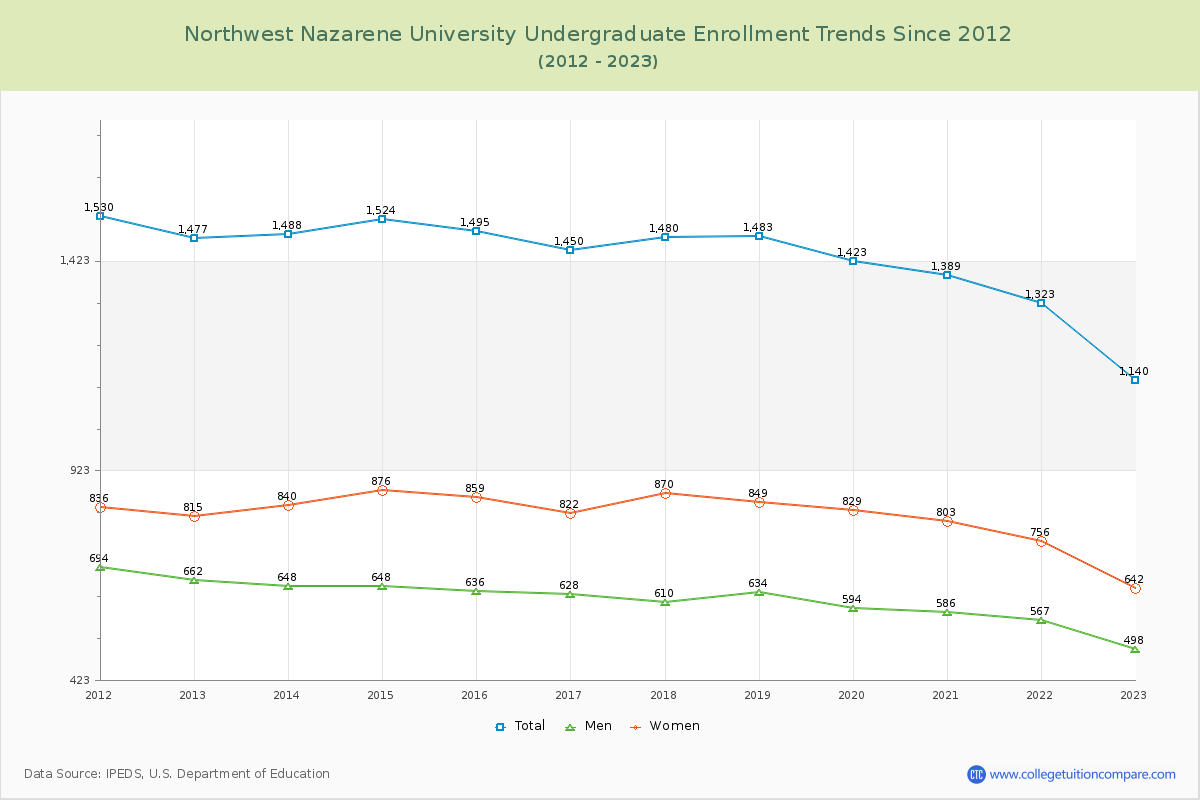
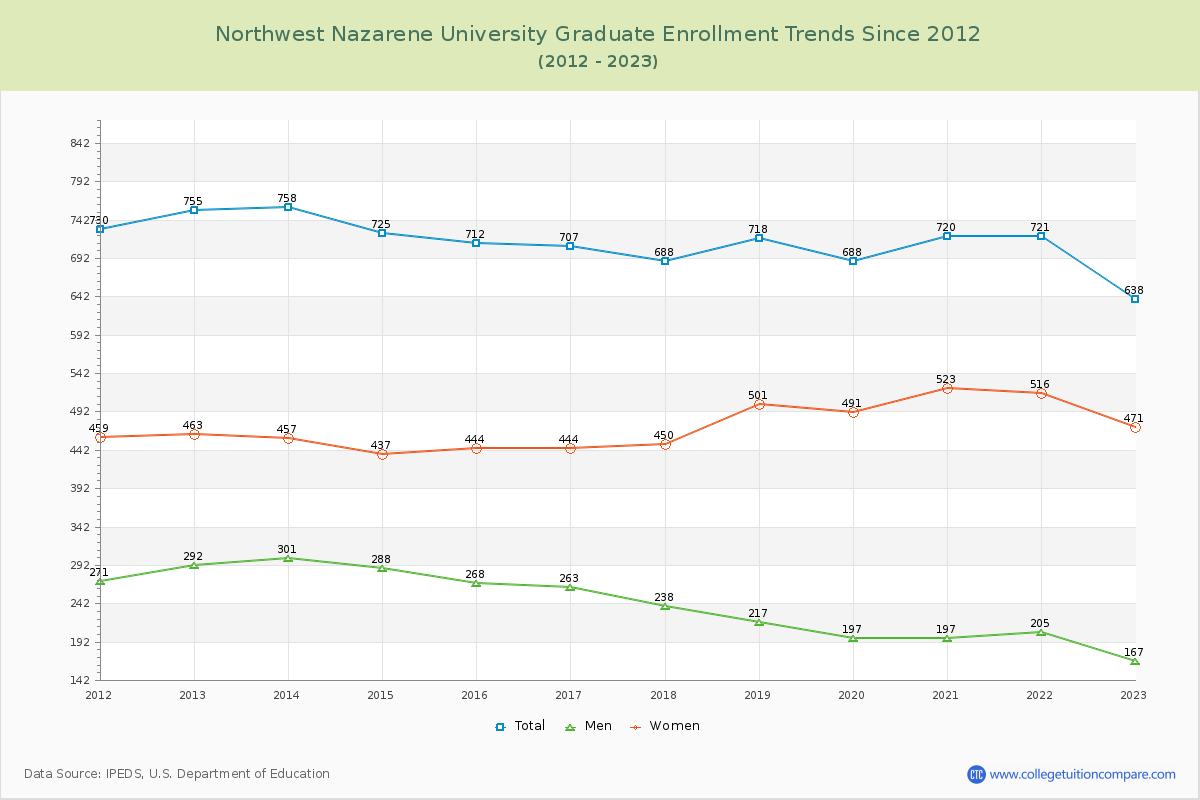
64.12% of total students is undergraduate students and 35.88% students is graduate students. The number of undergraduate students has decreased by 337 and the graduate enrollment has decreased by 117 over past 10 years.
The female to male ratio is 1.67 to 1 and it means that there are more female students enrolled in NNU than male students.
The following table and chart illustrate the changes in student population by gender at Northwest Nazarene University since 2012.
| Year | Total | Undergraduate | Graduate | ||||
|---|---|---|---|---|---|---|---|
| Total | Men | Women | Total | Men | Women | ||
| 2012-13 | 2,232 | 1,477 | 662 | 815 | 755 | 292 | 463 |
| 2013-14 | 2,246 14 | 1,488 11 | 648 -14 | 840 25 | 758 3 | 301 9 | 457 -6 |
| 2014-15 | 2,249 3 | 1,524 36 | 648 0 | 876 36 | 725 -33 | 288 -13 | 437 -20 |
| 2015-16 | 2,207 -42 | 1,495 -29 | 636 -12 | 859 -17 | 712 -13 | 268 -20 | 444 7 |
| 2016-17 | 2,157 -50 | 1,450 -45 | 628 -8 | 822 -37 | 707 -5 | 263 -5 | 444 0 |
| 2017-18 | 2,168 11 | 1,480 30 | 610 -18 | 870 48 | 688 -19 | 238 -25 | 450 6 |
| 2018-19 | 2,201 33 | 1,483 3 | 634 24 | 849 -21 | 718 30 | 217 -21 | 501 51 |
| 2019-20 | 2,111 -90 | 1,423 -60 | 594 -40 | 829 -20 | 688 -30 | 197 -20 | 491 -10 |
| 2020-21 | 2,109 -2 | 1,389 -34 | 586 -8 | 803 -26 | 720 32 | 197 0 | 523 32 |
| 2021-22 | 2,044 -65 | 1,323 -66 | 567 -19 | 756 -47 | 721 1 | 205 8 | 516 -7 |
| 2022-23 | 1,778 -266 | 1,140 -183 | 498 -69 | 642 -114 | 638 -83 | 167 -38 | 471 -45 |
| Average | 2,137 | 1,425 | 610 | 815 | 712 | 239 | 472 |