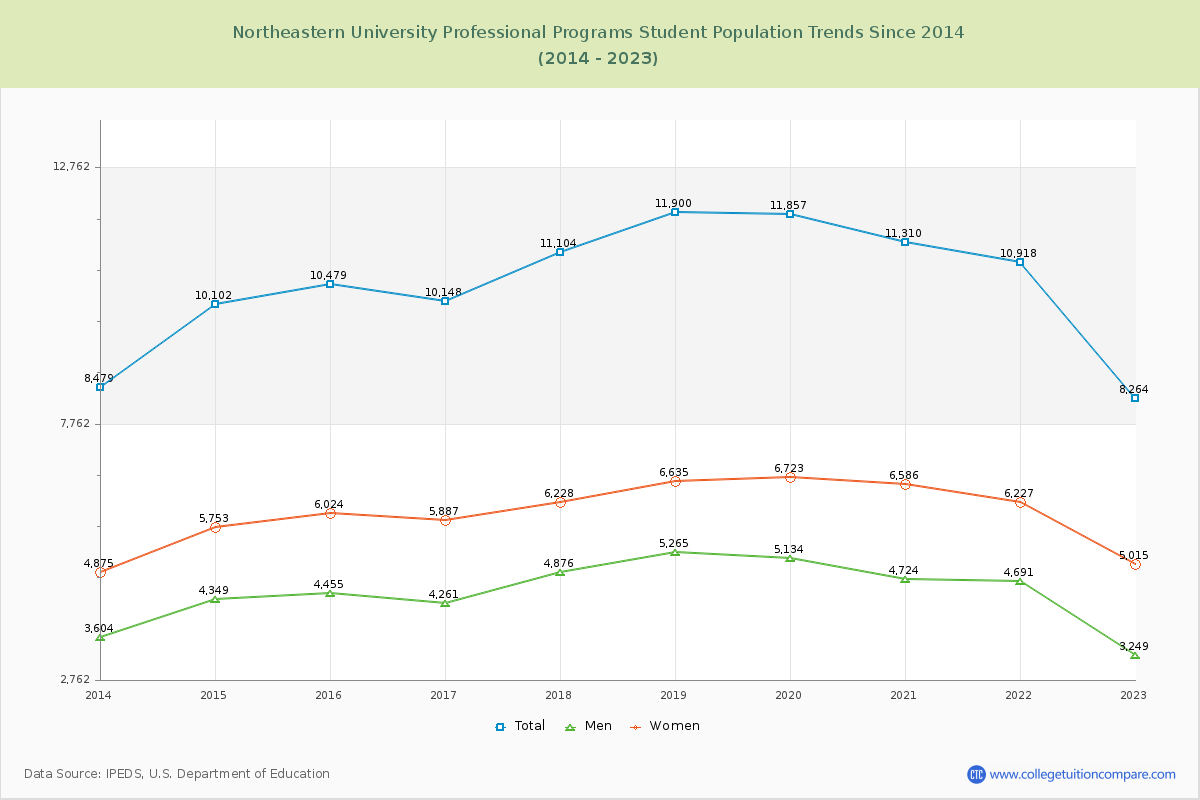
Student Population Changes
The average student population over the last 11 years is 10,456 where 8,264 students are attending the school for the academic year 2022-2023.
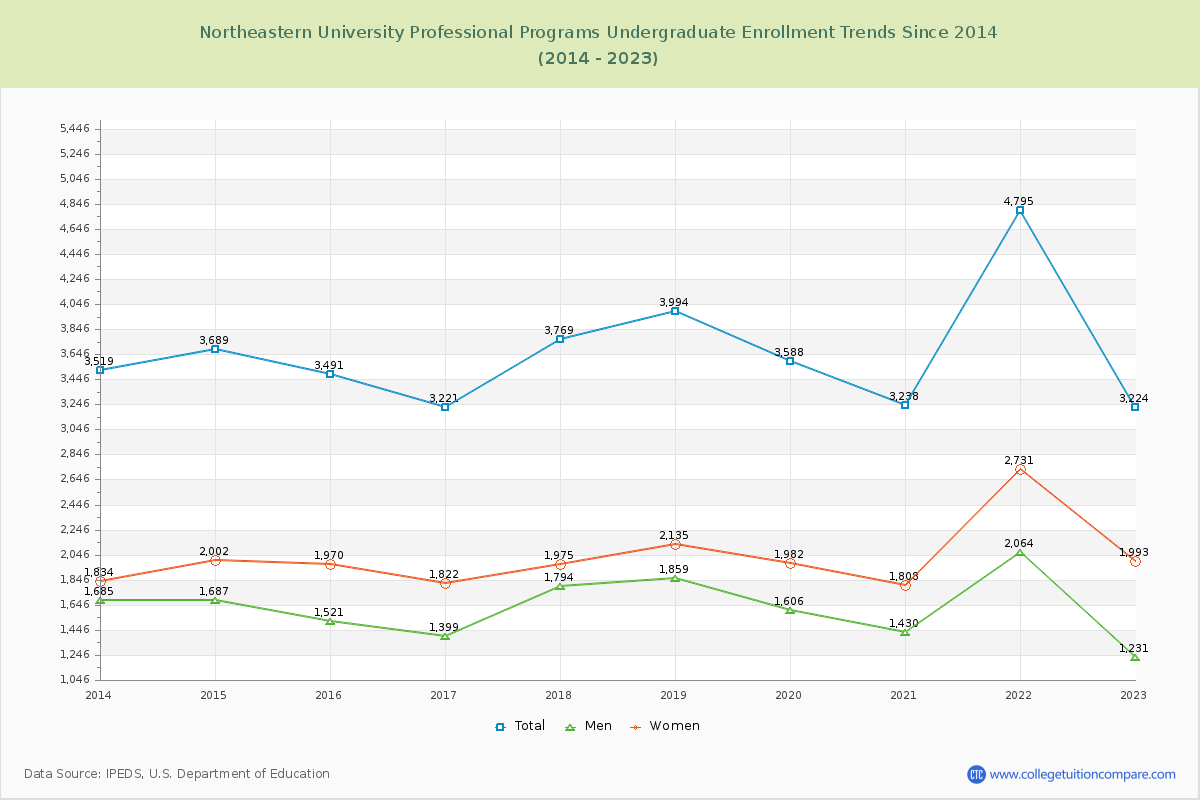
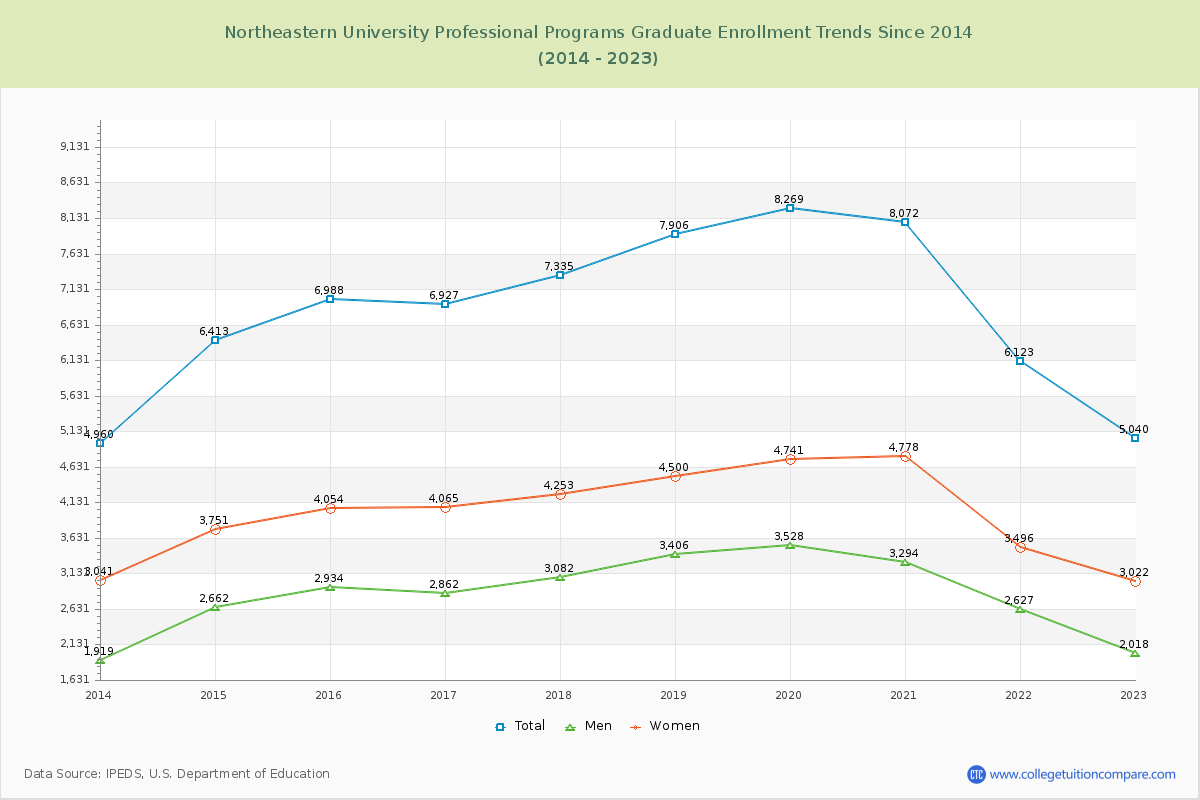
39.01% of total students is undergraduate students and 60.99% students is graduate students. The number of undergraduate students has decreased by 295 and the graduate enrollment has increased by 80 over past 10 years.
The female to male ratio is 1.54 to 1 and it means that there are more female students enrolled in Northeastern University Professional Programs than male students.
The following table and chart illustrate the changes in student population by gender at Northeastern University Professional Programs since 2013.
| Year | Total | Undergraduate | Graduate | ||||
|---|---|---|---|---|---|---|---|
| Total | Men | Women | Total | Men | Women | ||
| 2013-14 | 8,479 | 3,519 | 1,685 | 1,834 | 4,960 | 1,919 | 3,041 |
| 2014-15 | 10,102 1,623 | 3,689 170 | 1,687 2 | 2,002 168 | 6,413 1,453 | 2,662 743 | 3,751 710 |
| 2015-16 | 10,479 377 | 3,491 -198 | 1,521 -166 | 1,970 -32 | 6,988 575 | 2,934 272 | 4,054 303 |
| 2016-17 | 10,148 -331 | 3,221 -270 | 1,399 -122 | 1,822 -148 | 6,927 -61 | 2,862 -72 | 4,065 11 |
| 2017-18 | 11,104 956 | 3,769 548 | 1,794 395 | 1,975 153 | 7,335 408 | 3,082 220 | 4,253 188 |
| 2018-19 | 11,900 796 | 3,994 225 | 1,859 65 | 2,135 160 | 7,906 571 | 3,406 324 | 4,500 247 |
| 2019-20 | 11,857 -43 | 3,588 -406 | 1,606 -253 | 1,982 -153 | 8,269 363 | 3,528 122 | 4,741 241 |
| 2020-21 | 11,310 -547 | 3,238 -350 | 1,430 -176 | 1,808 -174 | 8,072 -197 | 3,294 -234 | 4,778 37 |
| 2021-22 | 10,918 -392 | 4,795 1,557 | 2,064 634 | 2,731 923 | 6,123 -1,949 | 2,627 -667 | 3,496 -1,282 |
| 2022-23 | 8,264 -2,654 | 3,224 -1,571 | 1,231 -833 | 1,993 -738 | 5,040 -1,083 | 2,018 -609 | 3,022 -474 |
| Average | 10,456 | 3,653 | 1,628 | 2,025 | 6,803 | 2,833 | 3,970 |