Student Population by Gender
Northeastern University Professional Programs has a total of 8,264 enrolled students for the academic year 2022-2023. 3,224 students have enrolled in undergraduate programs and 5,040 students joined graduate programs.
By gender, 3,249 male and 5,015 female students (the male-female ratio is 39:61) are attending the school. The gender distribution is based on the 2022-2023 data.
| Total | Undergraduate | Graduate | |
|---|---|---|---|
| Total | 8,264 | 3,224 | 5,040 |
| Men | 3,249 | 1,231 | 2,018 |
| Women | 5,015 | 1,993 | 3,022 |
Student Distribution by Race/Ethnicity
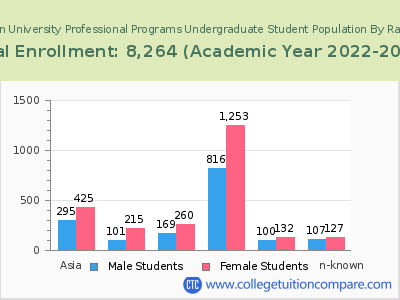
| Race | Total | Men | Women |
|---|---|---|---|
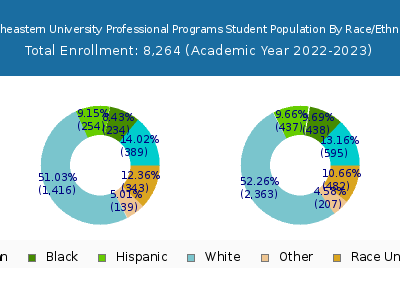
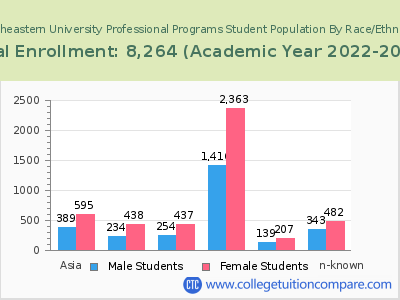
| American Indian or Native American | 5 | 2 | 3 |
| Asian | 663 | 236 | 427 |
| Black | 532 | 156 | 376 |
| Hispanic | 513 | 178 | 335 |
| Native Hawaiian or Other Pacific Islanders | 2 | 1 | 1 |
| White | 2,418 | 826 | 1,592 |
| Two or more races | 200 | 65 | 135 |
| Race Unknown | 416 | 128 | 288 |
| Race | Total | Men | Women |
|---|---|---|---|
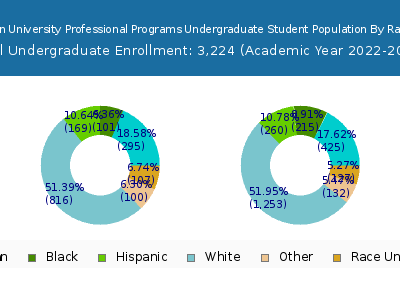
| American Indian or Native American | 4 | 2 | 2 |
| Asian | 463 | 172 | 291 |
| Black | 262 | 67 | 195 |
| Hispanic | 303 | 104 | 199 |
| Native Hawaiian or Other Pacific Islanders | 2 | 1 | 1 |
| White | 1,079 | 354 | 725 |
| Two or more races | 115 | 38 | 77 |
| Race Unknown | 155 | 39 | 116 |
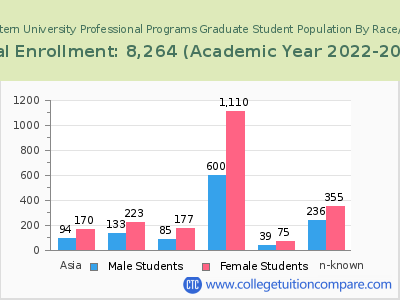
| Race | Total | Men | Women |
|---|---|---|---|
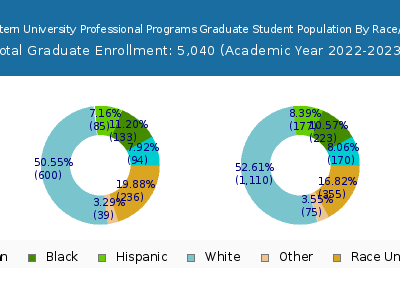
| American Indian or Native American | 0 | 0 | 0 |
| Asian | 52 | 19 | 33 |
| Black | 55 | 10 | 45 |
| Hispanic | 102 | 19 | 83 |
| Native Hawaiian or Other Pacific Islanders | 0 | 0 | 0 |
| White | 190 | 43 | 147 |
| Two or more races | 23 | 3 | 20 |
| Race Unknown | 70 | 4 | 66 |
Student Age Distribution
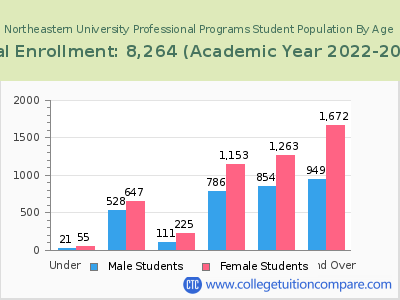
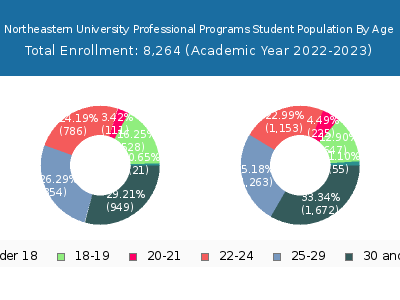
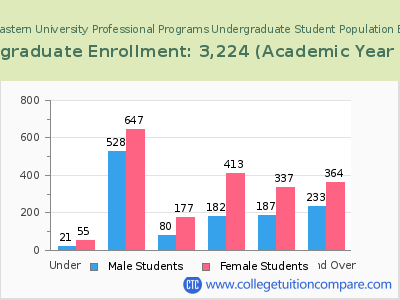
By age, Northeastern University Professional Programs has 76 students under 18 years old and 31 students over 65 years old. There are 3,526 students under 25 years old, and 4,738 students over 25 years old out of 8,264 total students.
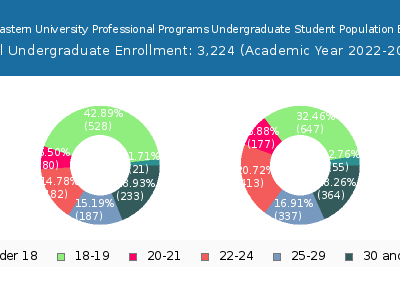
In undergraduate programs, 76 students are younger than 18 and 2 students are older than 65. Northeastern University Professional Programs has 2,103 undergraduate students aged under 25 and 1,121 students aged 25 and over.
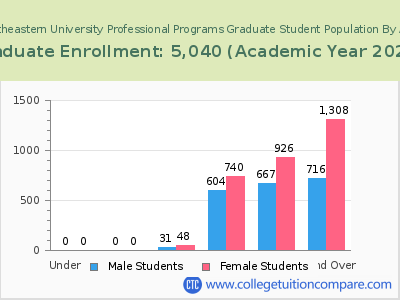
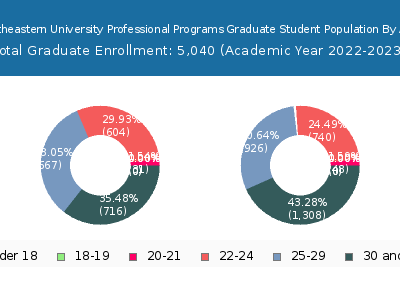
It has 1,423 graduate students aged under 25 and 3,617 students aged 25 and over.
| Age | Total | Men | Women |
|---|---|---|---|
| Under 18 | 76 | 55 | 21 |
| 18-19 | 1,175 | 647 | 528 |
| 20-21 | 336 | 225 | 111 |
| 22-24 | 1,939 | 1,153 | 786 |
| 25-29 | 2,117 | 1,263 | 854 |
| 30-34 | 901 | 567 | 334 |
| 35-39 | 575 | 353 | 222 |
| 40-49 | 693 | 462 | 231 |
| 50-64 | 421 | 271 | 150 |
| Over 65 | 31 | 19 | 12 |
| Age | Total | Men | Women |
|---|---|---|---|
| Under 18 | 76 | 55 | 21 |
| 18-19 | 1,175 | 647 | 528 |
| 20-21 | 257 | 177 | 80 |
| 22-24 | 595 | 413 | 182 |
| 25-29 | 524 | 337 | 187 |
| 30-34 | 205 | 126 | 79 |
| 35-39 | 147 | 82 | 65 |
| 40-49 | 155 | 100 | 55 |
| 50-64 | 88 | 55 | 33 |
| Over 65 | 2 | 1 | 1 |
| Age | Total | Men | Women |
|---|
Online Student Enrollment
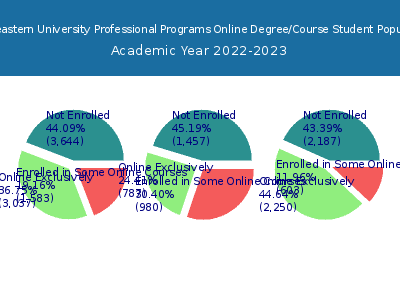
Distance learning, also called online education, is very attractive to students, especially who want to continue education and work in field. At Northeastern University Professional Programs, 3,037 students are enrolled exclusively in online courses and 1,583 students are enrolled in some online courses.
1,224 students lived in Massachusetts or jurisdiction in which the school is located are enrolled exclusively in online courses and 1,813 students live in other State or outside of the United States.
| All Students | Enrolled Exclusively Online Courses | Enrolled in Some Online Courses | |
|---|---|---|---|
| All Students | 8,264 | 3,037 | 1,583 |
| Undergraduate | 3,224 | 787 | 980 |
| Graduate | 5,040 | 2,250 | 603 |
| Massachusetts Residents | Other States in U.S. | Outside of U.S. | |
|---|---|---|---|
| All Students | 1,224 | 1,605 | 208 |
| Undergraduate | 426 | 321 | 40 |
| Graduate | 798 | 1,284 | 168 |
Transfer-in Students (Undergraduate)
Among 3,224 enrolled in undergraduate programs, 646 students have transferred-in from other institutions. The percentage of transfer-in students is 20.04%.315 students have transferred in as full-time status and 331 students transferred in as part-time status.
| Number of Students | |
|---|---|
| Regular Full-time | 1,493 |
| Transfer-in Full-time | 315 |
| Regular Part-time | 1,085 |
| Transfer-in Part-time | 331 |
