Enrollment Trends at North Central State

-386

Total Enrollment

-200

Men

-186

Women

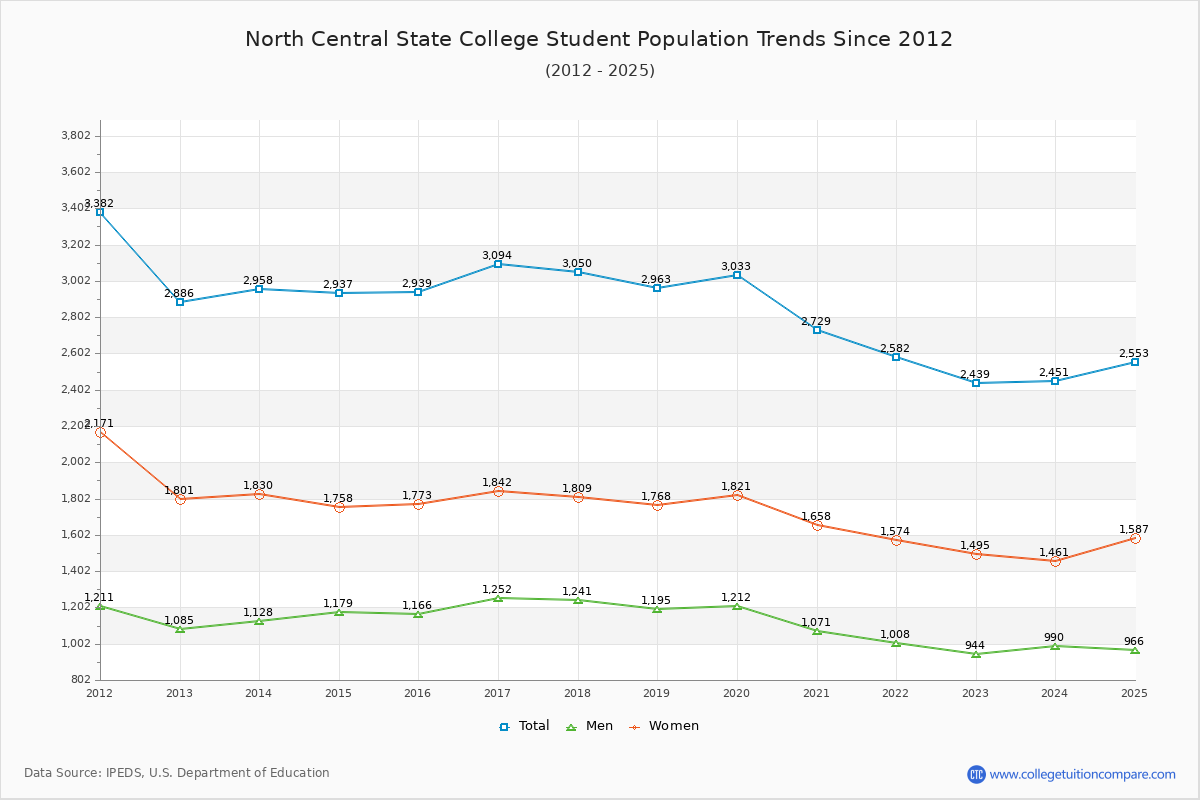
The student population at North Central State College is 2,553 (all undergraduate). The number of students has decreased by 386 over the past decade.

The female to male ratio is 1.64 to 1 which means that female students enrolled more than male students.

634 students enrolled in online degree program exclusively and the number of online students has increased by 317.11% since 2015.

Student Population Changes

The average student population over the last 11 years is 2,783 where 2,553 students are attending the school for the academic year 2024-2025.

The female to male ratio is 1.64 to 1 and it means that there are more female students enrolled in North Central State than male students.

The following table and chart illustrate the changes in student population by gender at North Central State College since 2015.

YearTotalMenWomen
2015-162,9391,1661,773
2016-173,094
155
1,252
86
1,842
69
2017-183,050
-44
1,241
-11
1,809
-33
2018-192,963
-87
1,195
-46
1,768
-41
2019-203,033
70
1,212
17
1,821
53
2020-212,729
-304
1,071
-141
1,658
-163
2021-222,582
-147
1,008
-63
1,574
-84
2022-232,439
-143
944
-64
1,495
-79
2023-242,451
12
990
46
1,461
-34
2024-252,553
102
966
-24
1,587
126
Average2,7831,1051,679
North Central State College Enrollment Trends Chart

Enrollment by Race/Ethnicity Changes

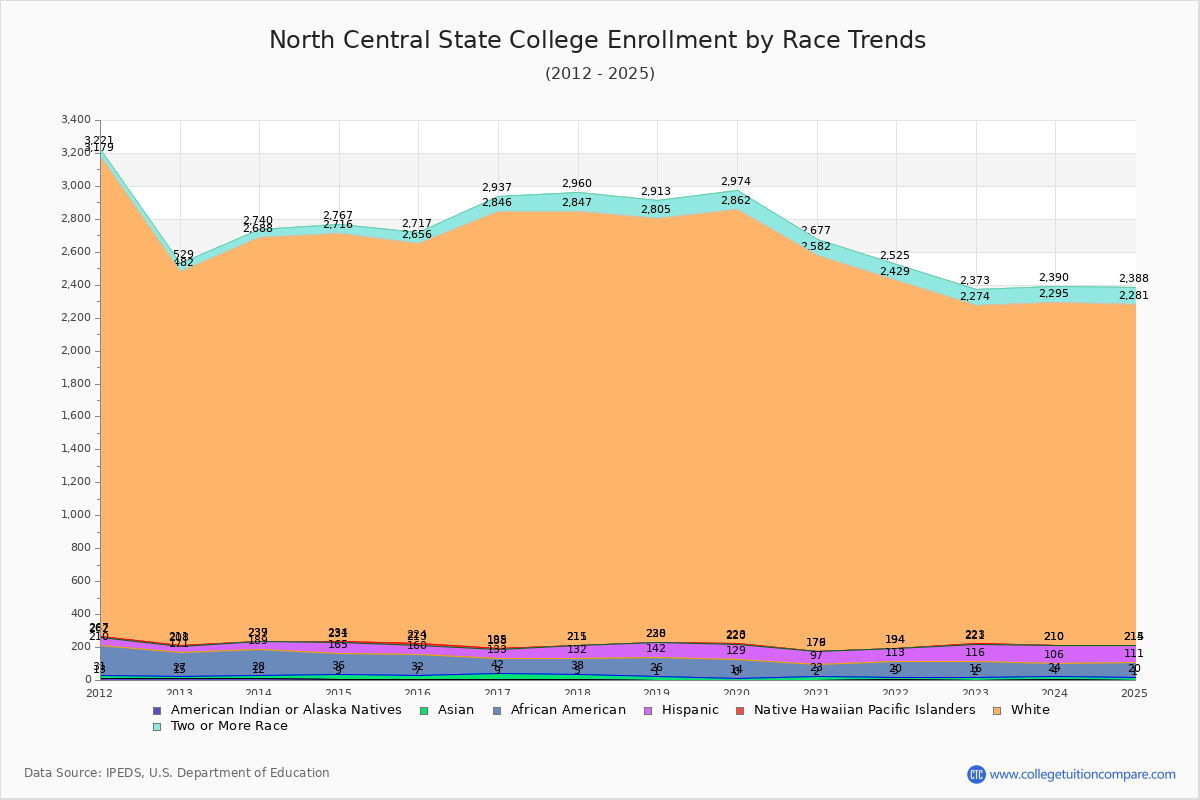
The percentage of white students is 80.92%. The percentage was 82.75% 10 years ago and North Central State still has a high percentage of white students. 0.74% of enrolled students is Asian and 3.56% is black students. Hispanic students comprise 4.03% of the student body.

Over the past 10 years, the racial composition has shifted. The percentage of white students decreased from 82.75% to 80.92%. Asian enrollment declined from 0.85% to 0.74%. Black student enrollment decreased from 4.36% to 3.56%. Hispanic student representation expanded from 1.80% to 4.03%.

The overall racial diversity, measured by the Census Bureau Diversity Index, is 0.3404 which indicates that somewhat diverse. This increased from 0.3125 a decade ago, suggesting that racial diversity has improved.

The following table and chart illustrate the student population trends by race/ethnicity at North Central State College over the past 11 years (2015-2025).

YearAmerican Indian or Native AmericanAsianBlackHispanicNative Hawaiian or Other Pacific IslanderWhiteTwo or More Races
2015-1672512853112,43261
2016-17933915572,65191
2017-18533947942,632113
2018-191251168622,575108
2019-200141159132,639112
2020-21221747932,40395
2021-22515938102,23596
2022-2321410010522,05199
2023-244208210402,08595
2024-251199110312,066107
Average422988432,37798
North Central State College Enrollment by Race Trends Chart

Distance Learning (Online Courses) Enrollment Changes

634 students are enrolled in online degree programs exclusively for the academic year 2024-2025, which is 25% of total students. The number of online students has increased 317.11% since 2015. The following table and chart illustrate the changes in the online student population by enrolled type at North Central State College from 2015 to 2025.

YearTotal EnrollmentOnline CompletelyEnrolled in Some Online CoursesNot Enrolled in Online Courses
2015-162,9391526432,144
2016-173,0942316422,221
2017-183,0502215962,233
2018-192,9632206302,113
2019-203,0333706592,004
2020-212,729803978948
2021-222,582776892914
2022-232,4395731,010856
2023-242,4516247981,029
2024-252,5536348871,032
Average2,7834607741,549

Ratings & Review

Share your experiences and thoughts about North Central State College. It will be a great help to applicants and prospective students!