Enrollment Trends at Newschool of Architecture and Design

-242

Total Enrollment

-199

Men

-43

Women

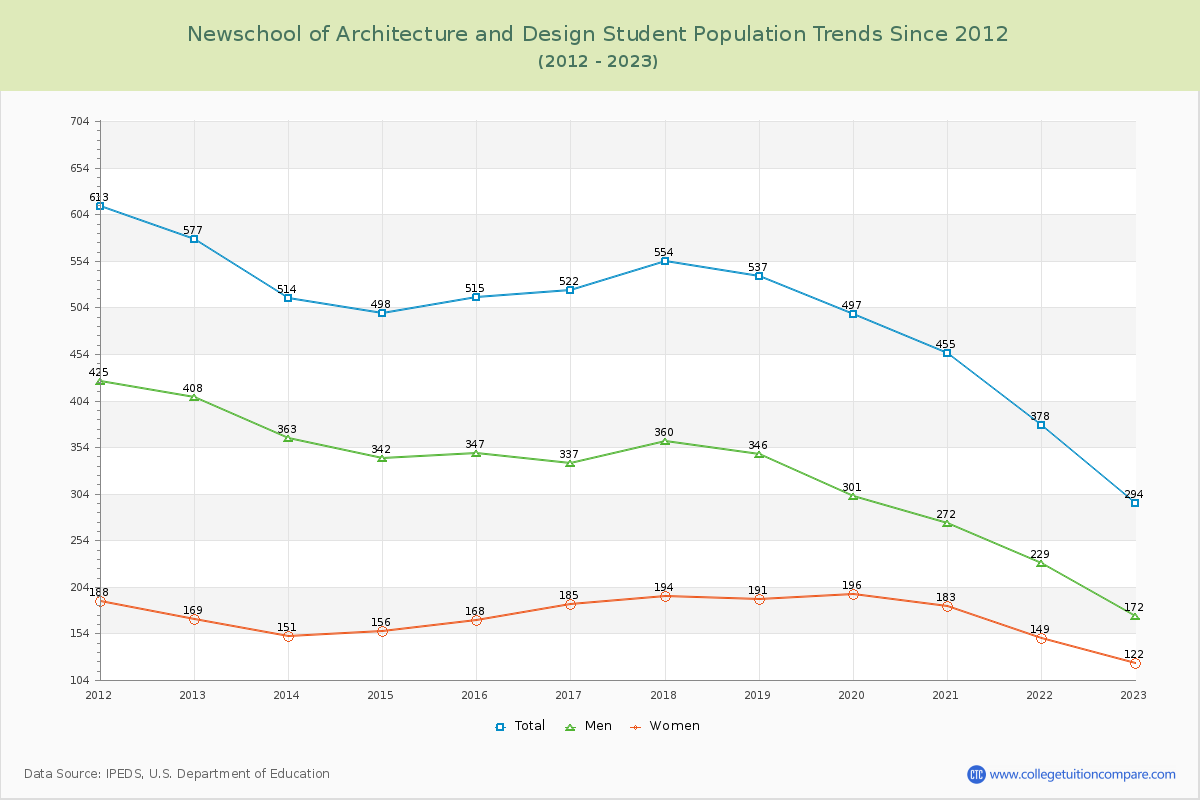
The student population at Newschool of Architecture and Design is 273 (183 undergraduate and 90 graduate students) . The number of students has decreased by 242 over the past decade.

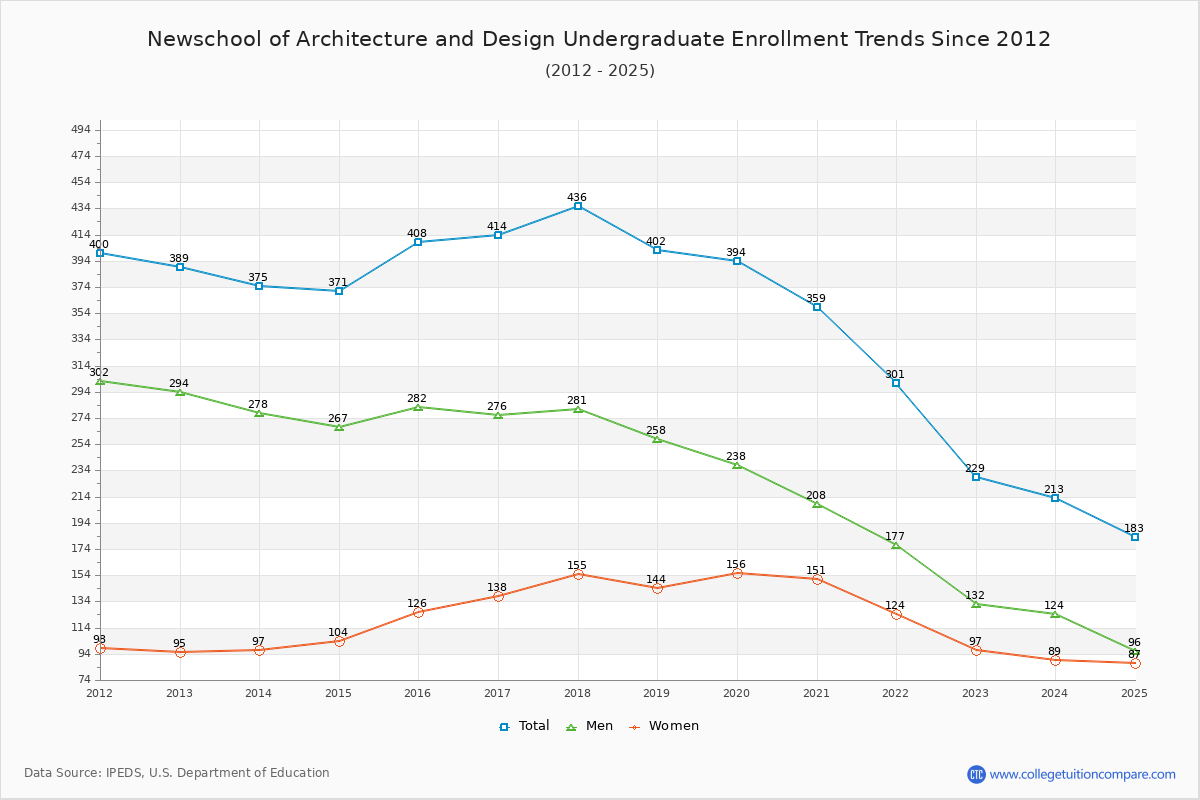
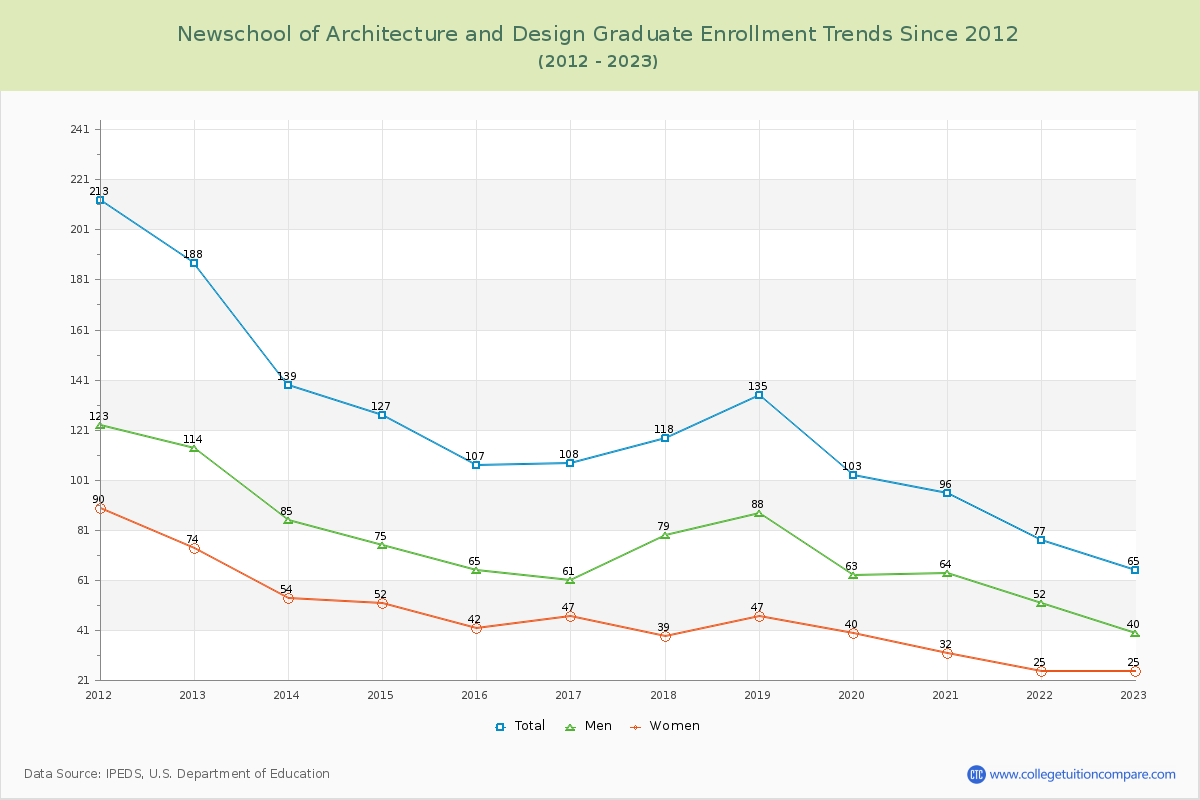
The percentage of undergraduate students at Newschool of Architecture and Design is 67.03% which is decreased by 225 over last 10 years. The graduate student population decreased by 17 and it has been decreasing.

The female to male ratio is 0.84 to 1 which means that male students enrolled slightly more than female students.

56 students enrolled in online degree program exclusively and the number of online students has increased by 211.11% since 2015.

Student Population Changes

The average student population over the last 11 years is 431 where 273 students are attending the school for the academic year 2024-2025.

67.03% of total students is undergraduate students and 32.97% students is graduate students. The number of undergraduate students has decreased by 225 and the graduate enrollment has decreased by 17 over past 10 years.

The female to male ratio is 0.84 to 1 and it means that there are slightly more male students enrolled in Newschool of Architecture and Design than female students.

The following table and chart illustrate the changes in student population by gender at Newschool of Architecture and Design since 2015.

YearTotalUndergraduateGraduate
TotalMenWomenTotalMenWomen
2015-165154082821261076542
2016-17522
7
414
6
276
-6
138
12
108
1
61
-4
47
5
2017-18554
32
436
22
281
5
155
17
118
10
79
18
39
-8
2018-19537
-17
402
-34
258
-23
144
-11
135
17
88
9
47
8
2019-20497
-40
394
-8
238
-20
156
12
103
-32
63
-25
40
-7
2020-21455
-42
359
-35
208
-30
151
-5
96
-7
64
1
32
-8
2021-22378
-77
301
-58
177
-31
124
-27
77
-19
52
-12
25
-7
2022-23294
-84
229
-72
132
-45
97
-27
65
-12
40
-12
25
2023-24280
-14
213
-16
124
-8
89
-8
67
2
41
1
26
1
2024-25273
-7
183
-30
96
-28
87
-2
90
23
52
11
38
12
Average431334207127976136
Newschool of Architecture and Design Enrollment Trends Chart

Undergraduate Enrollment Changes

The average number of Undergraduate students over the last 11 years is 334 where 183 students are attending the Undergraduate school for the academic year 2024-2025. The following table and chart illustrate the changes in Undergraduate enrollment by attending status and gender at Newschool of Architecture and Design since 2015.

YearTotalFull-timePart-time
TotalMenWomenTotalMenWomen
2015-16408368255113402713
2016-1741439126113023158
2017-18436407265142291613
2018-19402368236132342212
2019-20394348207141463115
2020-21359324184140352411
2021-22301258151107432617
2022-2322919911287302010
2023-24213178988035269
2024-251831457471382216
Average3343341841143342312
Newschool of Architecture and Design Undergraduate Enrollment Trends Chart

Graduate Enrollment Changes

The average number of Graduate students over the last 11 years is 97 where 90 students are attending the Graduate school for the academic year 2024-2025. The following table and chart illustrate the changes in Graduate enrollment by attending status and gender at Newschool of Architecture and Design since 2015.

YearTotalFull-timePart-time
TotalMenWomenTotalMenWomen
2015-161071006040752
2016-1710894504414113
2017-1811895623323176
2018-19135966234392613
2019-20103714427321913
2020-219679522717125
2021-227763422114104
2022-23655135161459
2023-24675638181138
2024-2590613427291811
Average9797482997137
Newschool of Architecture and Design Graduate Enrollment Trends Chart

Enrollment by Race/Ethnicity Changes

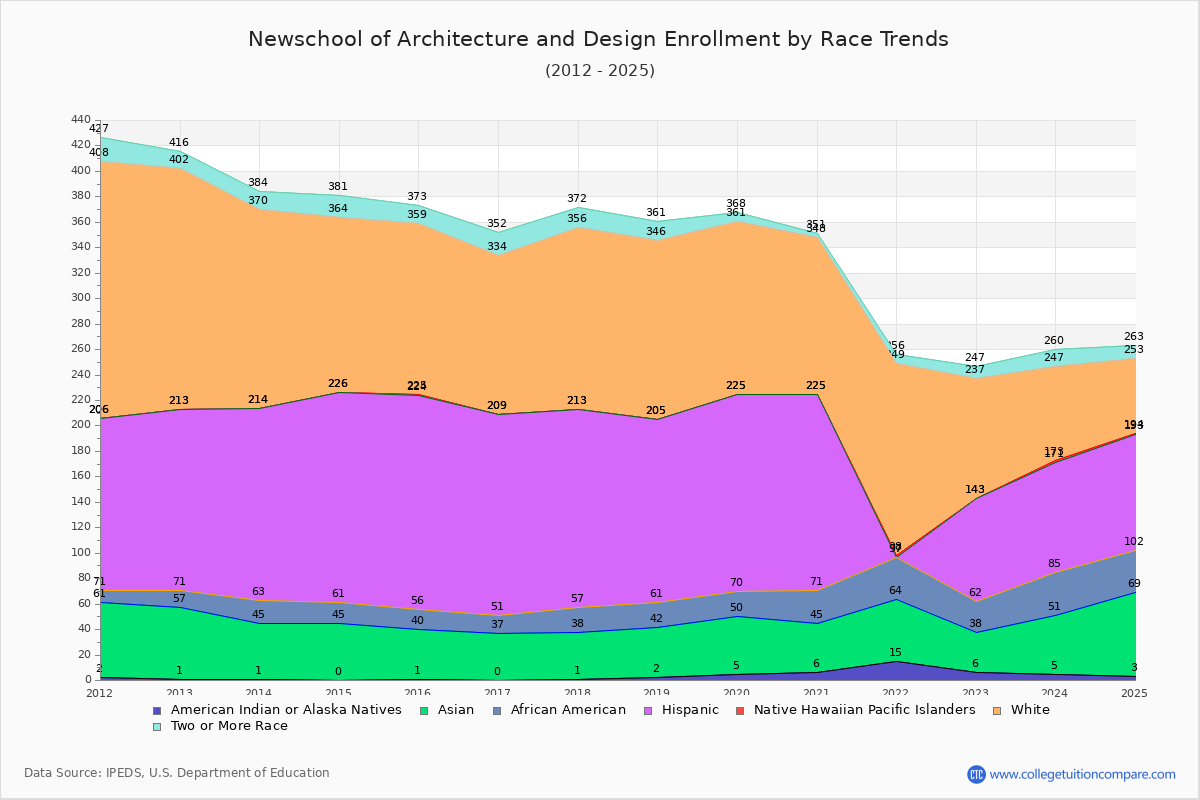
The percentage of white students is 21.61% and the percentage of black students is 12.09% at Newschool of Architecture and Design. 24.18% of enrolled students is Asian. Hispanic students comprise 33.33% of the student body.

Over the past 10 years, the racial composition has shifted. The percentage of white students decreased from 26.02% to 21.61%. Asian enrollment grew from 7.57% to 24.18%. Black student enrollment increased from 3.11% to 12.09%. Hispanic student representation expanded from 32.62% to 33.33%.

The overall racial diversity, measured by the Census Bureau Diversity Index, is 0.7676 which indicates that quite diverse. This decreased from 0.8184 a decade ago, suggesting that racial diversity has declined.

The following table and chart illustrate the student population trends by race/ethnicity at Newschool of Architecture and Design over the past 11 years (2015-2025).

YearAmerican Indian or Native AmericanAsianBlackHispanicNative Hawaiian or Other Pacific IslanderWhiteTwo or More Races
2015-1613916168113414
2016-1703714158012518
2017-1813719156014316
2018-1924019144014115
2019-205452015501367
2020-216392615401233
2021-22154933011517
2022-23632248109410
2023-24546348627413
2024-25366339115910
Average44324119111811
Newschool of Architecture and Design Enrollment by Race Trends Chart

Distance Learning (Online Courses) Enrollment Changes

56 students are enrolled in online degree programs exclusively for the academic year 2024-2025, which is 21% of total students. The number of online students has increased 211.11% since 2015. The following table and chart illustrate the changes in the online student population by enrolled type at Newschool of Architecture and Design from 2015 to 2025.

YearTotal EnrollmentOnline CompletelyEnrolled in Some Online CoursesNot Enrolled in Online Courses
2015-16515186491
2016-17522208494
2017-18554411512
2018-19537523482
2019-204973319445
2020-2145545500
2021-223782057301
2022-232941345236
2023-242803976165
2024-252735628189
Average4317524332

Ratings & Review

Share your experiences and thoughts about Newschool of Architecture and Design. It will be a great help to applicants and prospective students!