Student Population Changes
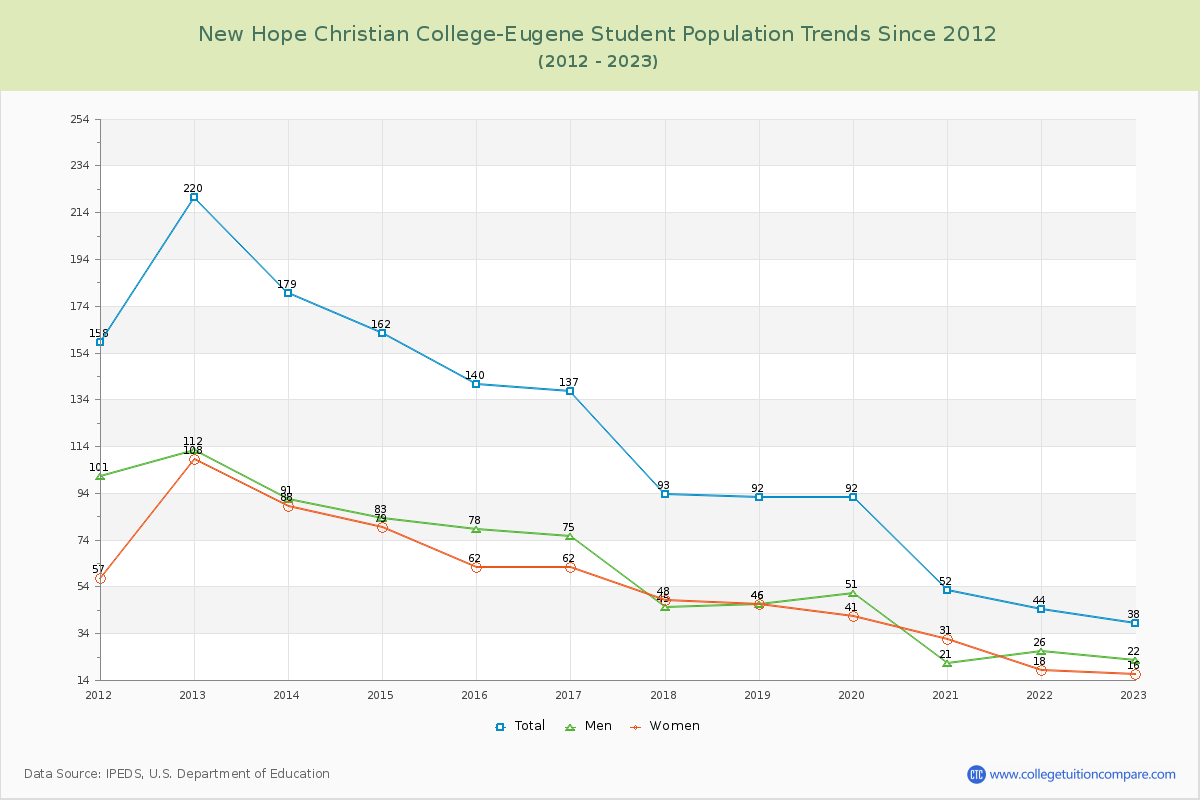
The average student population over the last 12 years is 112 where 38 students are attending the school for the academic year 2022-2023.
The female to male ratio is 0.73 to 1 and it means that there are more male students enrolled in New Hope Christian College-Eugene than female students.
The following table and chart illustrate the changes in student population by gender at New Hope Christian College-Eugene since 2012.
| Year | Total | Men | Women |
|---|---|---|---|
| 2012-13 | 220 | 112 | 108 |
| 2013-14 | 179 -41 | 91 -21 | 88 -20 |
| 2014-15 | 162 -17 | 83 -8 | 79 -9 |
| 2015-16 | 140 -22 | 78 -5 | 62 -17 |
| 2016-17 | 128 -12 | 69 -9 | 59 -3 |
| 2017-18 | 86 -42 | 40 -29 | 46 -13 |
| 2018-19 | 92 6 | 46 6 | 46 0 |
| 2019-20 | 92 0 | 51 5 | 41 -5 |
| 2020-21 | 52 -40 | 21 -30 | 31 -10 |
| 2021-22 | 44 -8 | 26 5 | 18 -13 |
| 2022-23 | 38 -6 | 22 -4 | 16 -2 |
| Average | 112 | 58 | 54 |