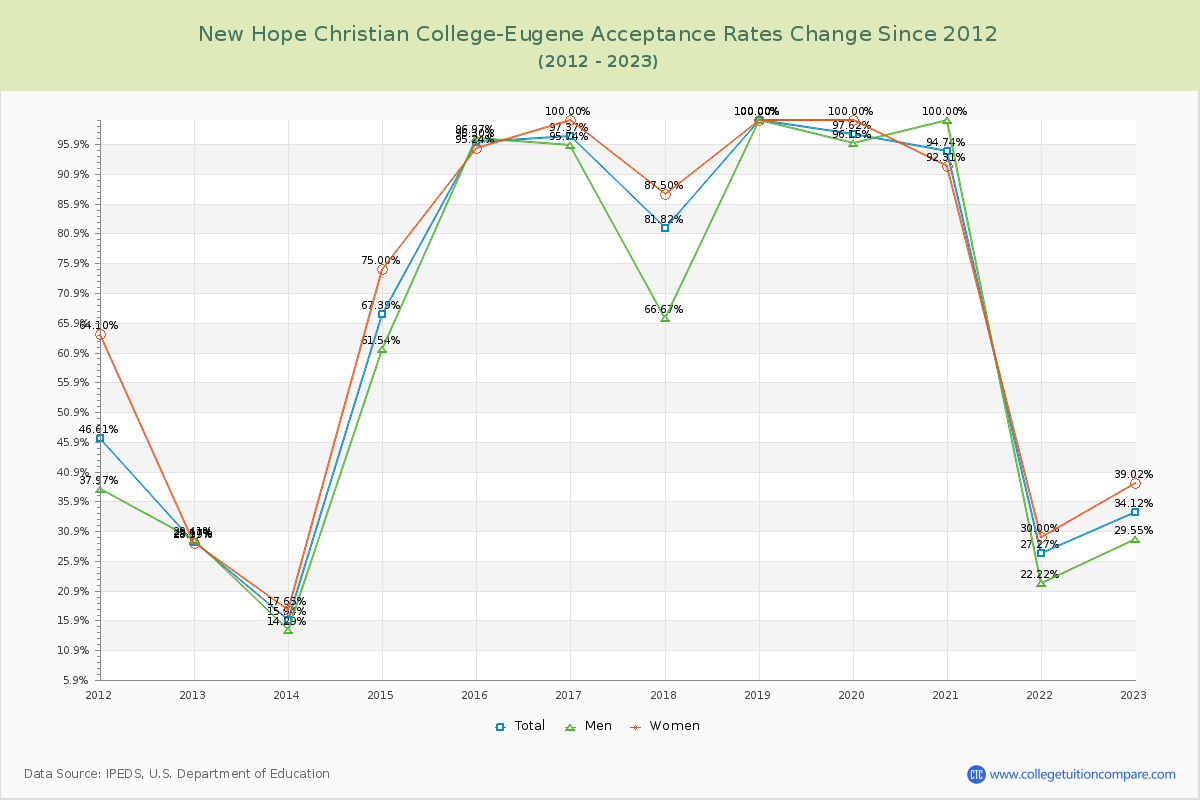
Acceptance Rate Changes
The average acceptance rate over the last 10 years is 67.43%, and this year's acceptance rate is 34.12% at New Hope Christian College-Eugene. By gender, men students' acceptance rate is 64.78% and women students' rate is 69.61%. For 2023 admission, it was easier to get into New Hope Christian College-Eugene than the previous year.
The next table and chart illustrate the acceptance rates changes at New Hope Christian College-Eugene over the past 11 years (2012-2023).
| Year | Total | Men | Women |
|---|---|---|---|
| 2012-13 | 29.17% | 29.41% | 28.99% |
| 2013-14 | 15.94% -13.22% |
14.29% -11.34% |
17.65% -11.34% |
| 2014-15 | 67.39% 51.45% |
61.54% 57.35% |
75.00% 57.35% |
| 2015-16 | 96.30% 28.91% |
96.97% 20.24% |
95.24% 20.24% |
| 2016-17 | 97.37% 1.07% |
95.74% 4.76% |
100.00% 4.76% |
| 2017-18 | 81.82% -15.55% |
66.67% -12.50% |
87.50% -12.50% |
| 2018-19 | 100.00% 18.18% |
100.00% 12.50% |
100.00% 12.50% |
| 2019-20 | 97.62% -2.38% |
96.15% 0.00% |
100.00% 0.00% |
| 2020-21 | 94.74% -2.88% |
100.00% -7.69% |
92.31% -7.69% |
| 2021-22 | 27.27% -67.46% |
22.22% -62.31% |
30.00% -62.31% |
| 2022-23 | 34.12% 6.84% |
29.55% 9.02% |
39.02% 9.02% |
| Average | 67.43% | 64.78% | 69.61% |