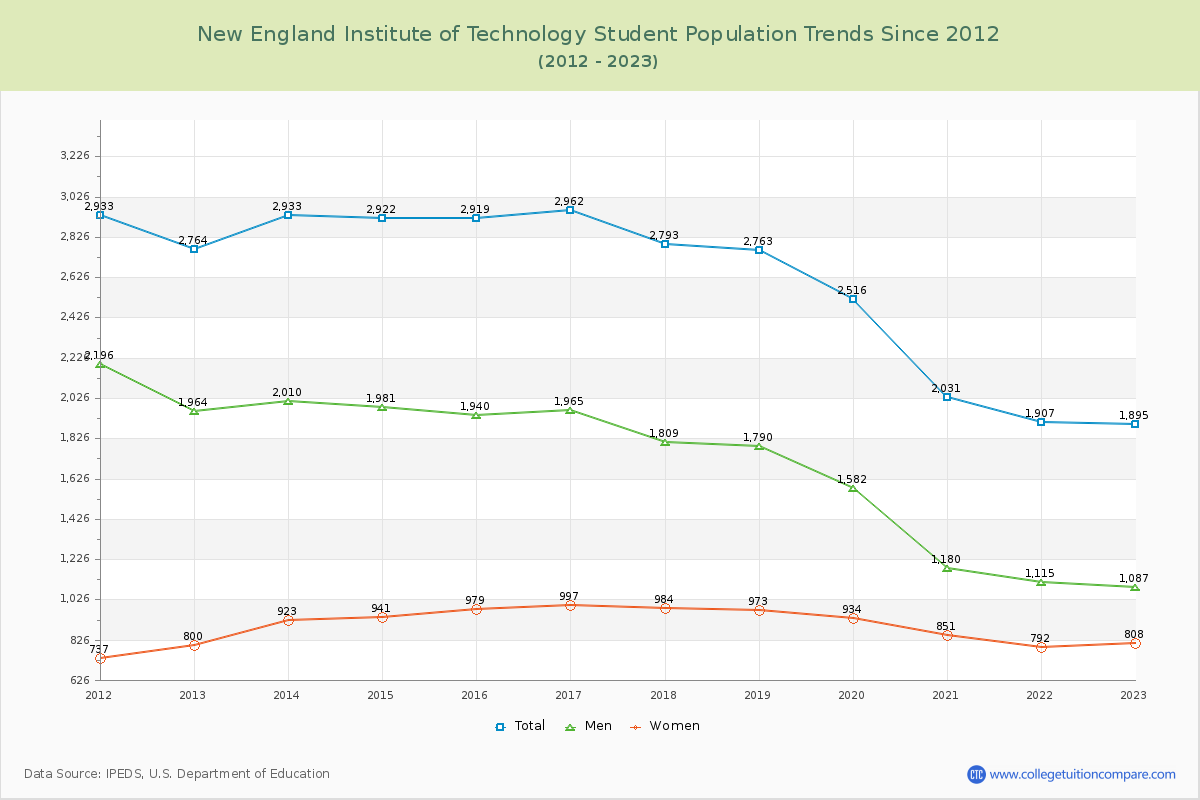
Student Population Changes
The average student population over the last 12 years is 2,582 where 1,895 students are attending the school for the academic year 2022-2023.
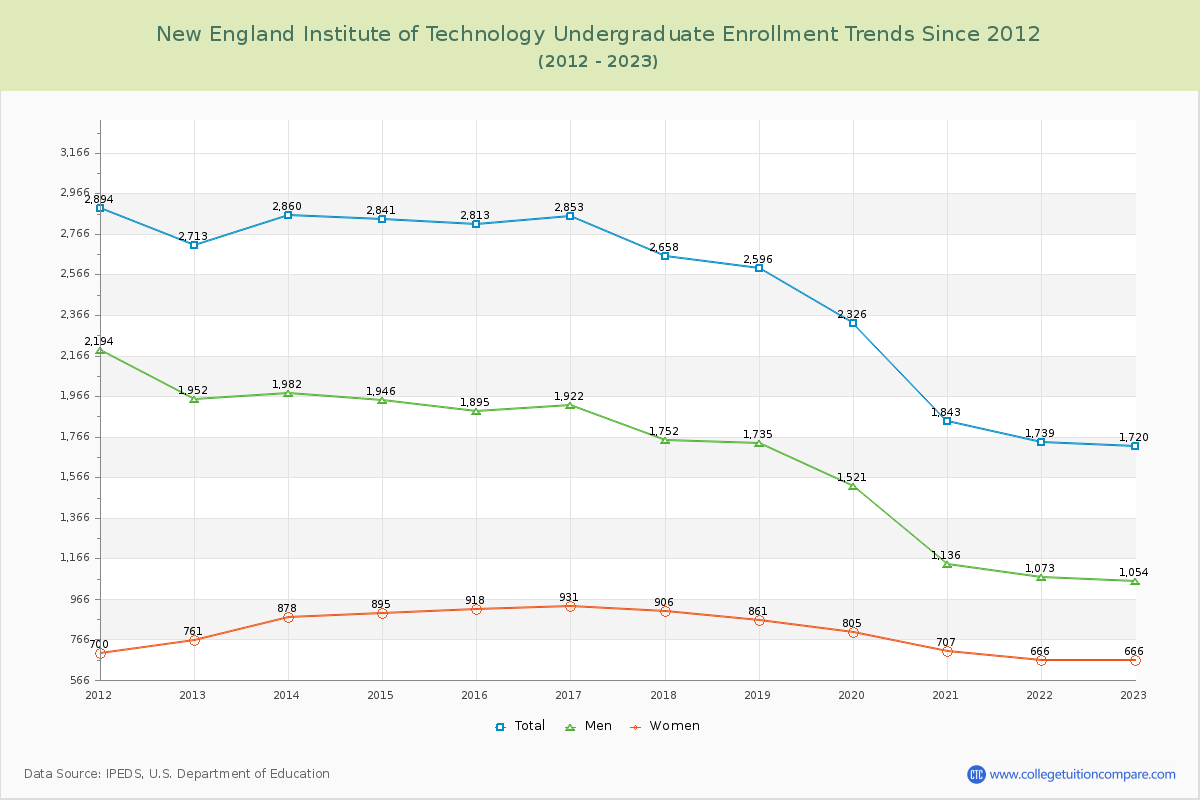
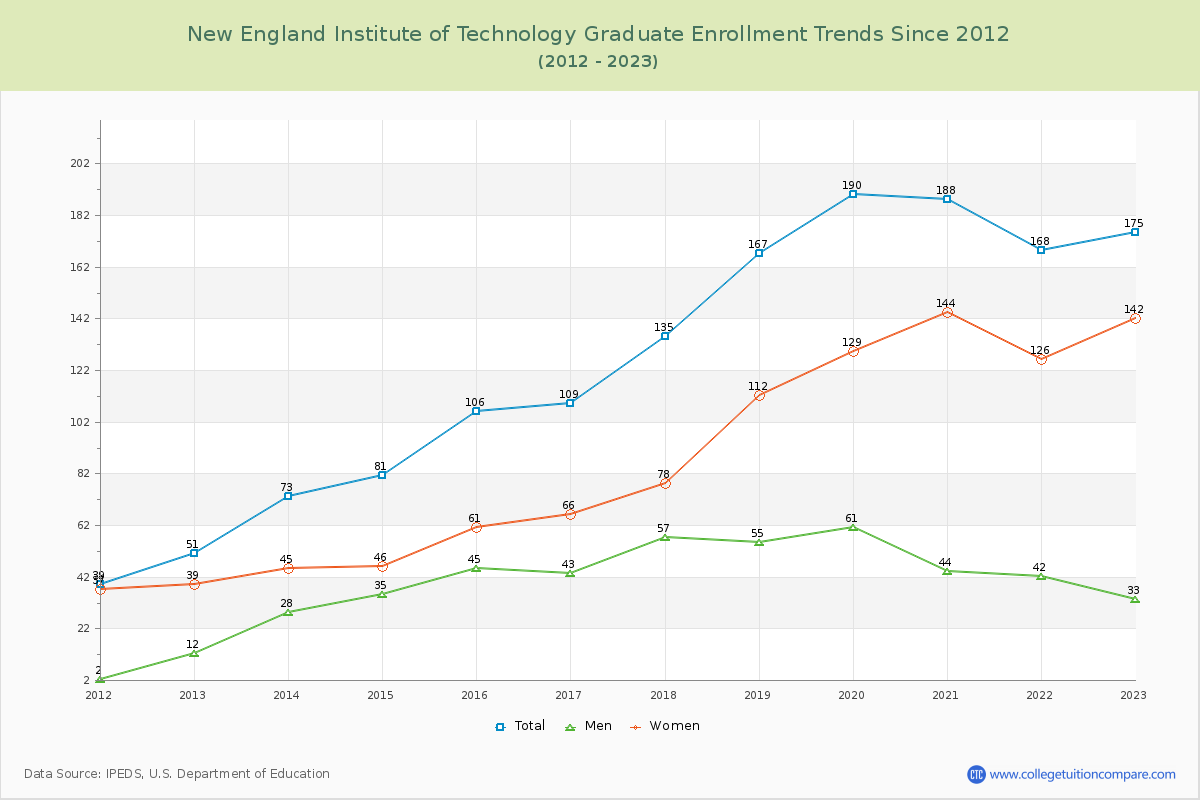
90.77% of total students is undergraduate students and 9.23% students is graduate students. The number of undergraduate students has decreased by 993 and the graduate enrollment has increased by 124 over past 10 years.
The female to male ratio is 0.74 to 1 and it means that there are more male students enrolled in New England Tech than female students.
The following table and chart illustrate the changes in student population by gender at New England Institute of Technology since 2012.
| Year | Total | Undergraduate | Graduate | ||||
|---|---|---|---|---|---|---|---|
| Total | Men | Women | Total | Men | Women | ||
| 2012-13 | 2,764 | 2,713 | 1,952 | 761 | 51 | 12 | 39 |
| 2013-14 | 2,933 169 | 2,860 147 | 1,982 30 | 878 117 | 73 22 | 28 16 | 45 6 |
| 2014-15 | 2,922 -11 | 2,841 -19 | 1,946 -36 | 895 17 | 81 8 | 35 7 | 46 1 |
| 2015-16 | 2,919 -3 | 2,813 -28 | 1,895 -51 | 918 23 | 106 25 | 45 10 | 61 15 |
| 2016-17 | 2,962 43 | 2,853 40 | 1,922 27 | 931 13 | 109 3 | 43 -2 | 66 5 |
| 2017-18 | 2,793 -169 | 2,658 -195 | 1,752 -170 | 906 -25 | 135 26 | 57 14 | 78 12 |
| 2018-19 | 2,763 -30 | 2,596 -62 | 1,735 -17 | 861 -45 | 167 32 | 55 -2 | 112 34 |
| 2019-20 | 2,516 -247 | 2,326 -270 | 1,521 -214 | 805 -56 | 190 23 | 61 6 | 129 17 |
| 2020-21 | 2,031 -485 | 1,843 -483 | 1,136 -385 | 707 -98 | 188 -2 | 44 -17 | 144 15 |
| 2021-22 | 1,907 -124 | 1,739 -104 | 1,073 -63 | 666 -41 | 168 -20 | 42 -2 | 126 -18 |
| 2022-23 | 1,895 -12 | 1,720 -19 | 1,054 -19 | 666 0 | 175 7 | 33 -9 | 142 16 |
| Average | 2,582 | 2,451 | 1,633 | 818 | 131 | 41 | 90 |