Enrollment Trends at National Career Education

289

Total Enrollment

297

Men

-8

Women

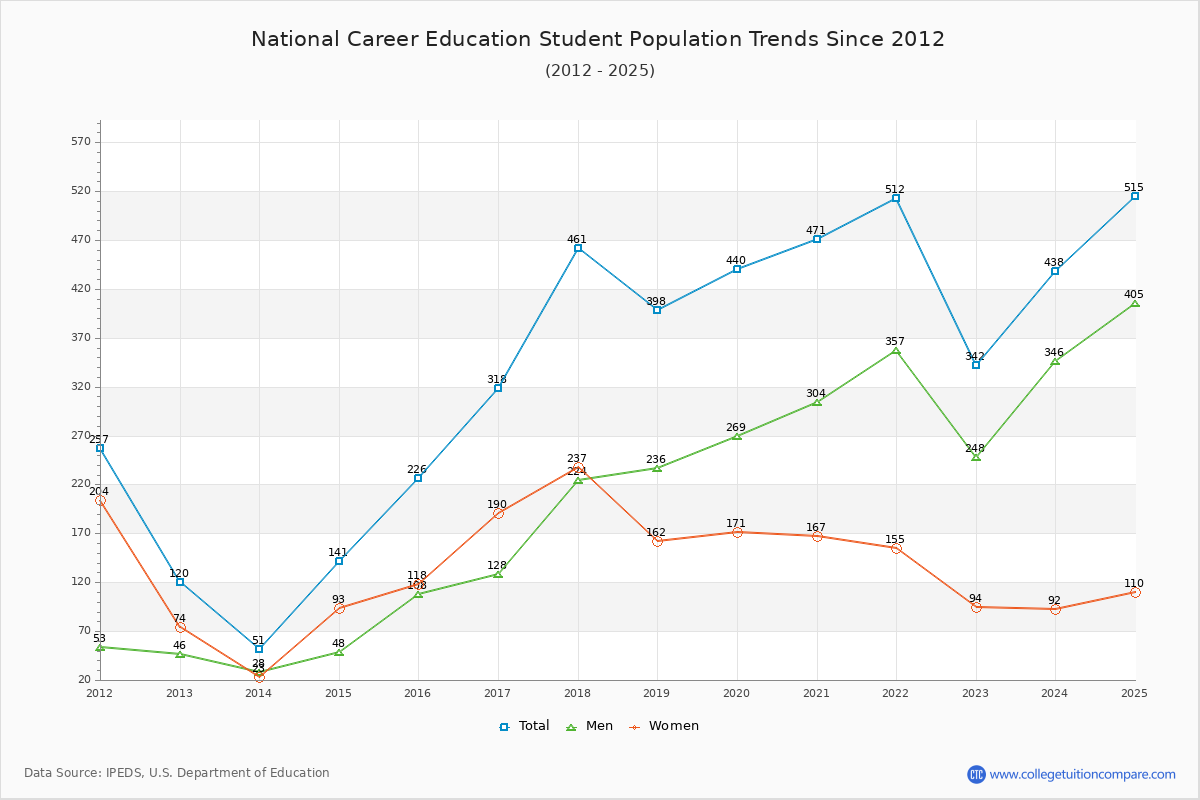
The student population at National Career Education is 515 (all undergraduate). The number of students has increased by 289 over the past decade.

The female to male ratio is 0.27 to 1 which means that majority of population is on male students.

All students have enrolled in on-campus classes (National Career Education does not offer online degree/certificate program).

Student Population Changes

The average student population over the last 11 years is 412 where 515 students are attending the school for the academic year 2024-2025.

The female to male ratio is 0.27 to 1 and it means that there are far more male students enrolled in National Career Education than female students.

The following table and chart illustrate the changes in student population by gender at National Career Education since 2015.

YearTotalMenWomen
2015-16226108118
2016-17318
92
128
20
190
72
2017-18461
143
224
96
237
47
2018-19398
-63
236
12
162
-75
2019-20440
42
269
33
171
9
2020-21471
31
304
35
167
-4
2021-22512
41
357
53
155
-12
2022-23342
-170
248
-109
94
-61
2023-24438
96
346
98
92
-2
2024-25515
77
405
59
110
18
Average412263150
National Career Education Enrollment Trends Chart

Enrollment by Race/Ethnicity Changes

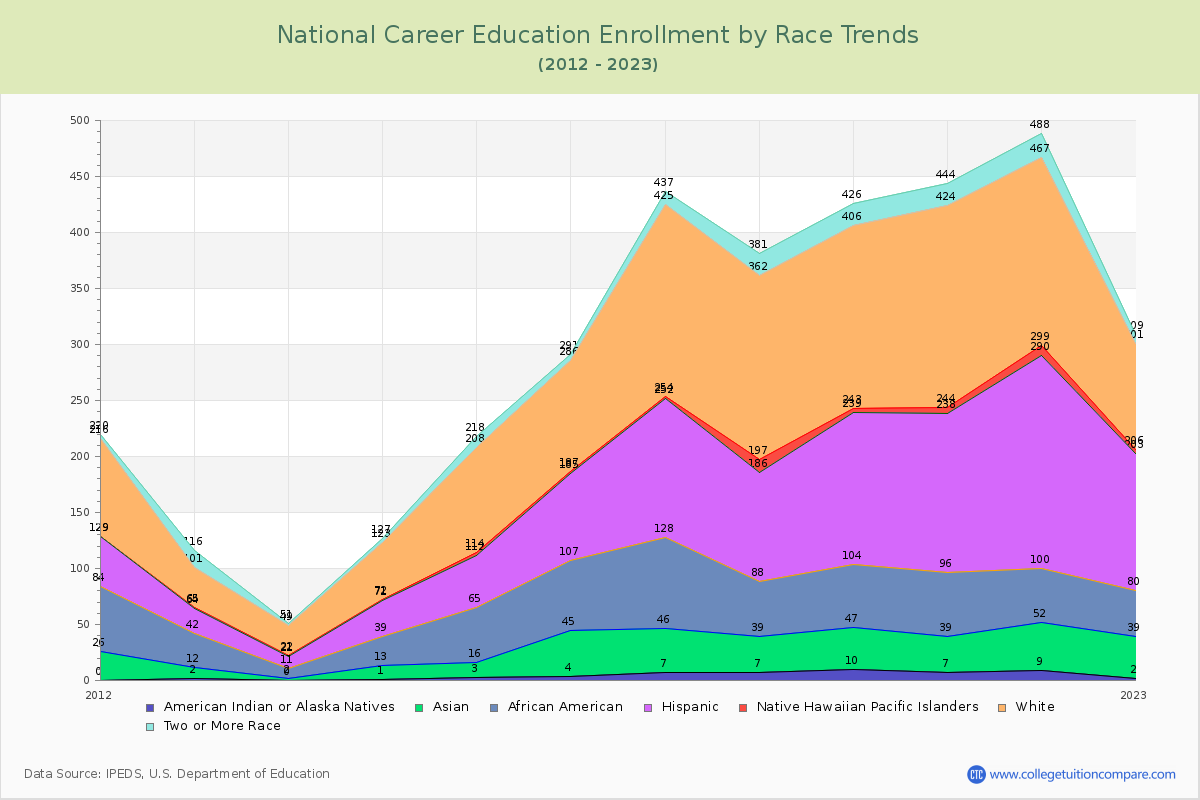
The percentage of white students is 32.62% and the percentage of black students is 10.68% at National Career Education. 9.13% of enrolled students is Asian. Hispanic students comprise 39.03% of the student body.

Over the past 10 years, the racial composition has shifted. The percentage of white students decreased from 41.59% to 32.62%. Asian enrollment grew from 5.75% to 9.13%. Black student enrollment decreased from 21.68% to 10.68%. Hispanic student representation expanded from 20.80% to 39.03%.

The overall racial diversity, measured by the Census Bureau Diversity Index, is 0.7206 which indicates that quite diverse. This decreased from 0.7312 a decade ago, suggesting that racial diversity has declined.

The following table and chart illustrate the student population trends by race/ethnicity at National Career Education over the past 11 years (2015-2025).

YearAmerican Indian or Native AmericanAsianBlackHispanicNative Hawaiian or Other Pacific IslanderWhiteTwo or More Races
2015-16313494729410
2016-1744162782995
2017-1873982124217112
2018-1973249981116519
2019-20103757135416320
2020-2173257142618020
2021-2294348190916821
2022-23237411233958
2023-244454518141216
2024-2524755201616814
Average63755132514214
National Career Education Enrollment by Race Trends Chart

Distance Learning (Online Courses) Enrollment Changes

National Career Education does not offer online degree/certificate programs. All Students have enrolled in on-campus programs.


Ratings & Review

Share your experiences and thoughts about National Career Education. It will be a great help to applicants and prospective students!