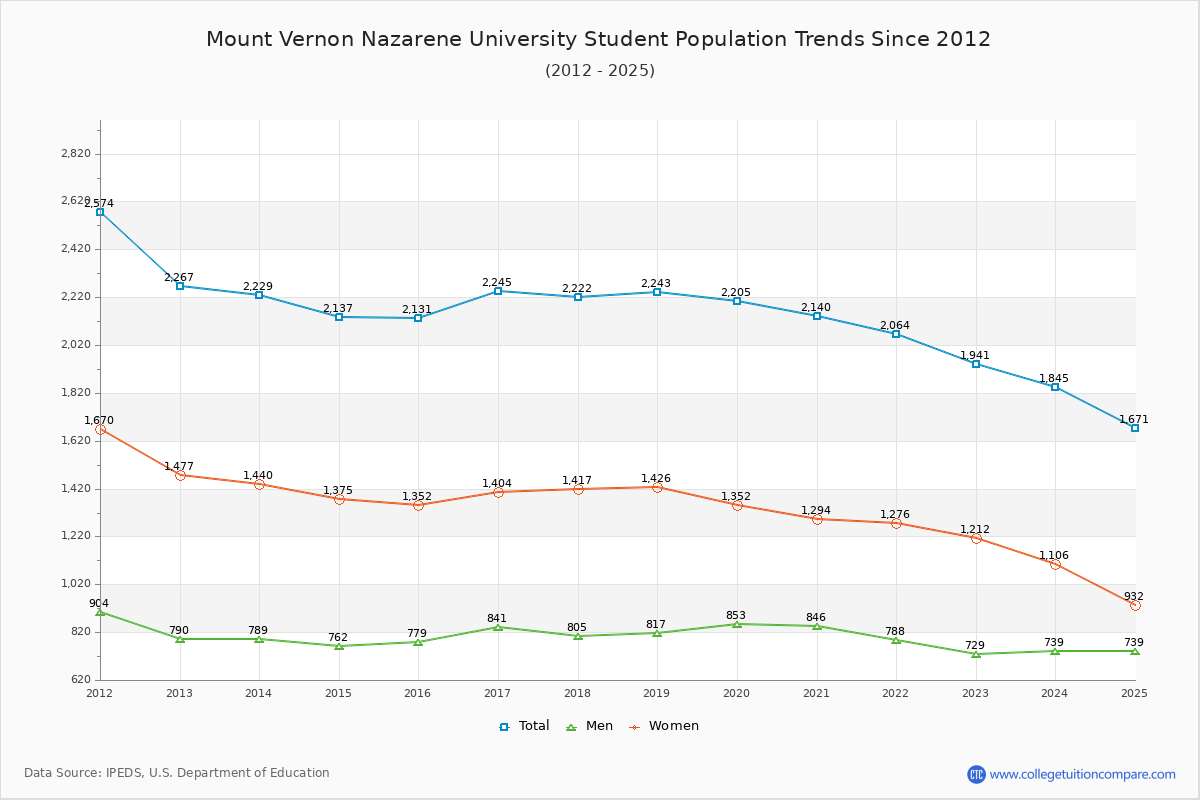
Student Population Changes
The average student population over the last 12 years is 2,166 where 1,941 students are attending the school for the academic year 2022-2023.
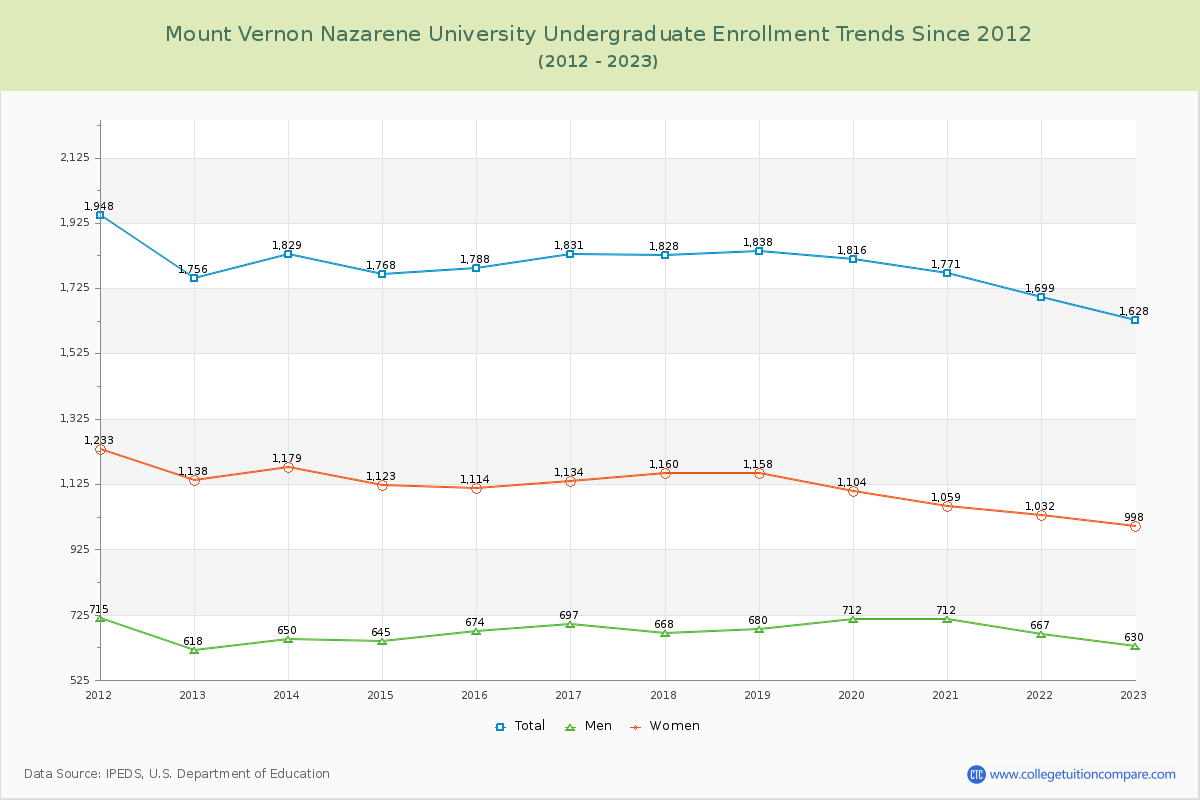
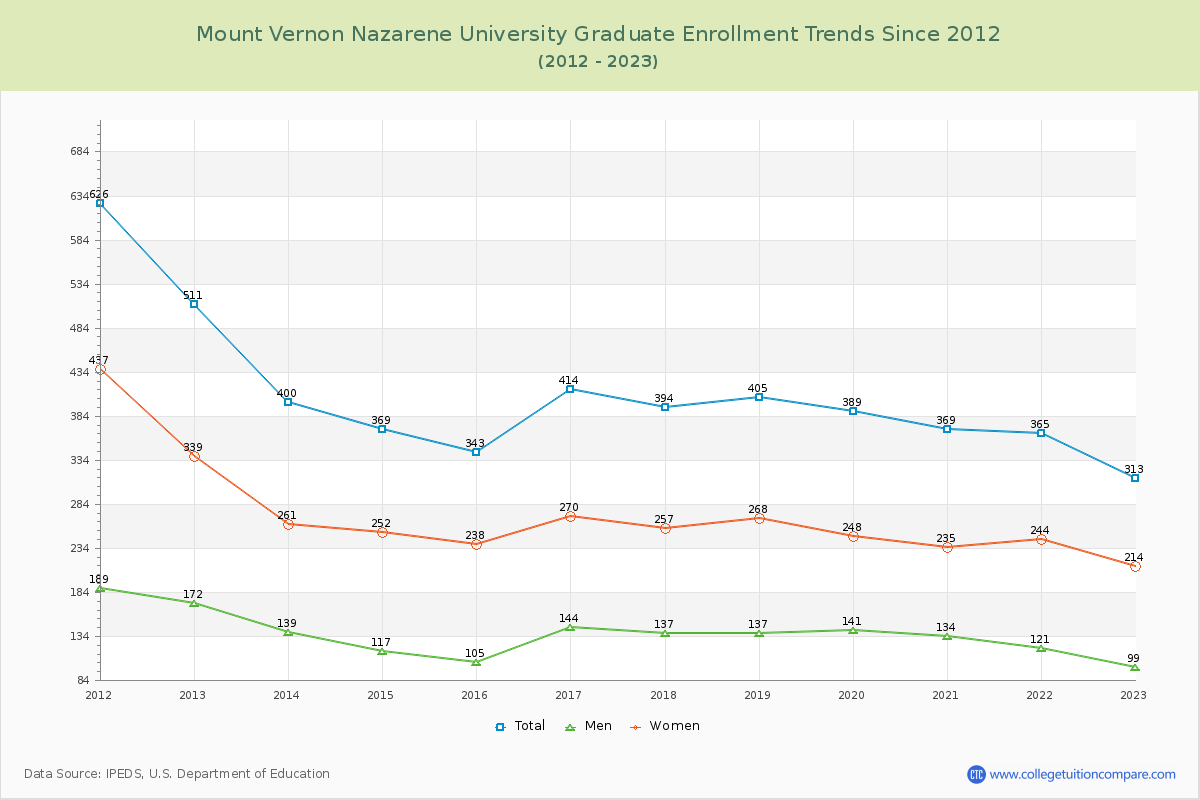
83.87% of total students is undergraduate students and 16.13% students is graduate students. The number of undergraduate students has decreased by 128 and the graduate enrollment has decreased by 198 over past 10 years.
The female to male ratio is 1.66 to 1 and it means that there are more female students enrolled in MVNU than male students.
The following table and chart illustrate the changes in student population by gender at Mount Vernon Nazarene University since 2012.
| Year | Total | Undergraduate | Graduate | ||||
|---|---|---|---|---|---|---|---|
| Total | Men | Women | Total | Men | Women | ||
| 2012-13 | 2,267 | 1,756 | 618 | 1,138 | 511 | 172 | 339 |
| 2013-14 | 2,229 -38 | 1,829 73 | 650 32 | 1,179 41 | 400 -111 | 139 -33 | 261 -78 |
| 2014-15 | 2,137 -92 | 1,768 -61 | 645 -5 | 1,123 -56 | 369 -31 | 117 -22 | 252 -9 |
| 2015-16 | 2,131 -6 | 1,788 20 | 674 29 | 1,114 -9 | 343 -26 | 105 -12 | 238 -14 |
| 2016-17 | 2,245 114 | 1,831 43 | 697 23 | 1,134 20 | 414 71 | 144 39 | 270 32 |
| 2017-18 | 2,222 -23 | 1,828 -3 | 668 -29 | 1,160 26 | 394 -20 | 137 -7 | 257 -13 |
| 2018-19 | 2,243 21 | 1,838 10 | 680 12 | 1,158 -2 | 405 11 | 137 0 | 268 11 |
| 2019-20 | 2,205 -38 | 1,816 -22 | 712 32 | 1,104 -54 | 389 -16 | 141 4 | 248 -20 |
| 2020-21 | 2,140 -65 | 1,771 -45 | 712 0 | 1,059 -45 | 369 -20 | 134 -7 | 235 -13 |
| 2021-22 | 2,064 -76 | 1,699 -72 | 667 -45 | 1,032 -27 | 365 -4 | 121 -13 | 244 9 |
| 2022-23 | 1,941 -123 | 1,628 -71 | 630 -37 | 998 -34 | 313 -52 | 99 -22 | 214 -30 |
| Average | 2,166 | 1,777 | 668 | 1,109 | 388 | 131 | 257 |