Student Population by Gender
Mount Vernon Nazarene University has a total of 1,941 enrolled students for the academic year 2022-2023. 1,628 students have enrolled in undergraduate programs and 313 students joined graduate programs.
By gender, 729 male and 1,212 female students (the male-female ratio is 38:62) are attending the school. The gender distribution is based on the 2022-2023 data.
| Total | Undergraduate | Graduate | |
|---|---|---|---|
| Total | 1,941 | 1,628 | 313 |
| Men | 729 | 630 | 99 |
| Women | 1,212 | 998 | 214 |
Student Distribution by Race/Ethnicity
| Race | Total | Men | Women |
|---|---|---|---|
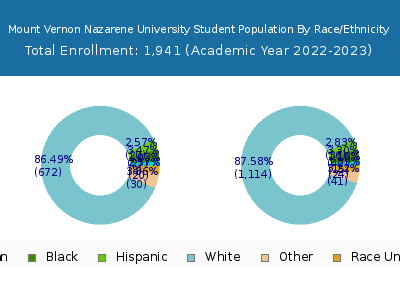
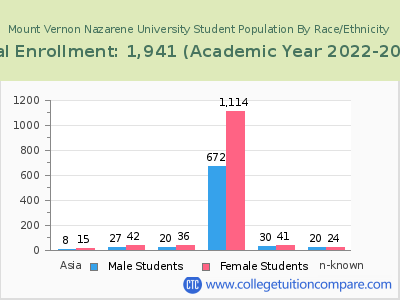
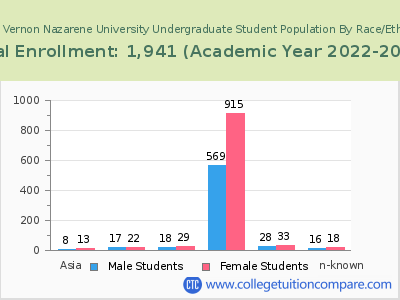
| American Indian or Native American | 6 | 2 | 4 |
| Asian | 18 | 5 | 13 |
| Black | 58 | 17 | 41 |
| Hispanic | 53 | 21 | 32 |
| Native Hawaiian or Other Pacific Islanders | 4 | 1 | 3 |
| White | 1,688 | 627 | 1,061 |
| Two or more races | 67 | 31 | 36 |
| Race Unknown | 38 | 17 | 21 |
| Race | Total | Men | Women |
|---|---|---|---|
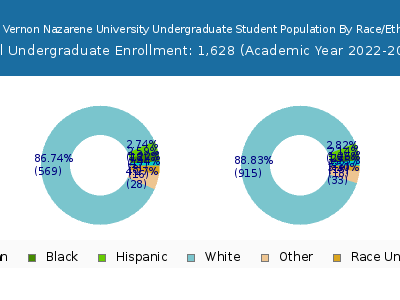
| American Indian or Native American | 5 | 2 | 3 |
| Asian | 13 | 3 | 10 |
| Black | 39 | 11 | 28 |
| Hispanic | 42 | 19 | 23 |
| Native Hawaiian or Other Pacific Islanders | 2 | 1 | 1 |
| White | 1,431 | 542 | 889 |
| Two or more races | 63 | 31 | 32 |
| Race Unknown | 24 | 13 | 11 |
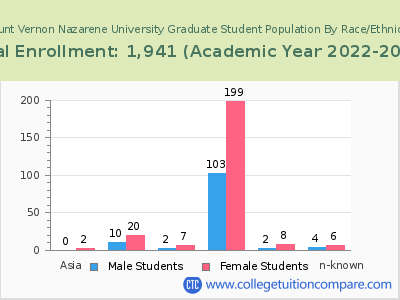
| Race | Total | Men | Women |
|---|---|---|---|
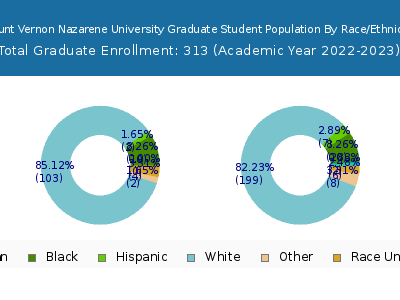
| American Indian or Native American | 0 | 0 | 0 |
| Asian | 2 | 0 | 2 |
| Black | 3 | 1 | 2 |
| Hispanic | 4 | 3 | 1 |
| Native Hawaiian or Other Pacific Islanders | 1 | 0 | 1 |
| White | 87 | 26 | 61 |
| Two or more races | 6 | 3 | 3 |
| Race Unknown | 2 | 1 | 1 |
Student Age Distribution
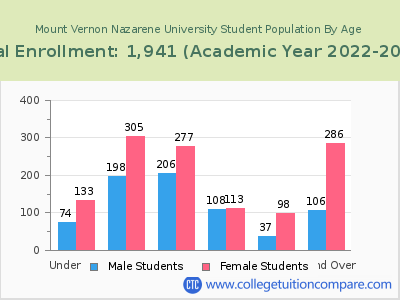
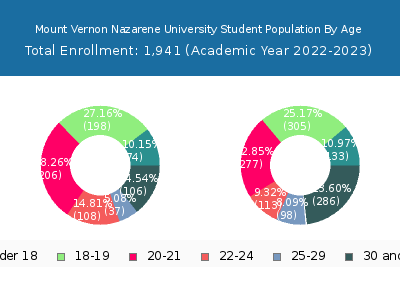
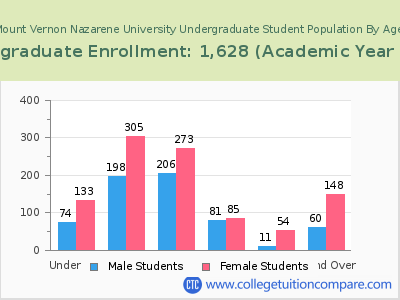
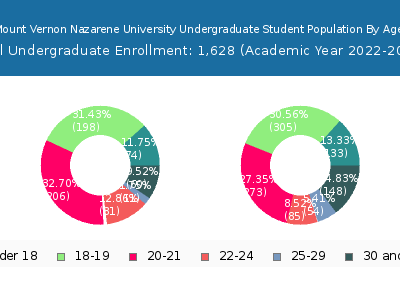
By age, MVNU has 207 students under 18 years old and 2 students over 65 years old. There are 1,414 students under 25 years old, and 527 students over 25 years old out of 1,941 total students.
In undergraduate programs, 207 students are younger than 18 and 1 students are older than 65. MVNU has 1,355 undergraduate students aged under 25 and 273 students aged 25 and over.
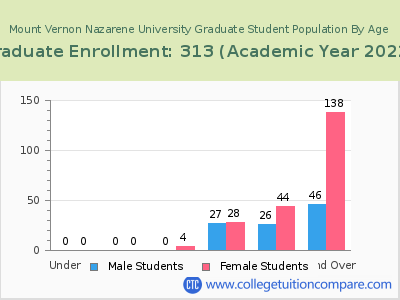
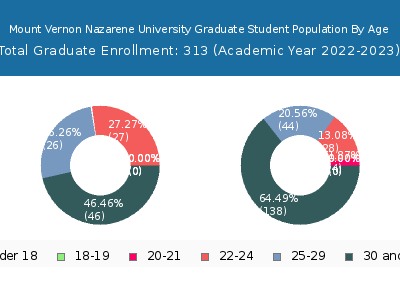
It has 59 graduate students aged under 25 and 254 students aged 25 and over.
| Age | Total | Men | Women |
|---|---|---|---|
| Under 18 | 207 | 133 | 74 |
| 18-19 | 503 | 305 | 198 |
| 20-21 | 483 | 277 | 206 |
| 22-24 | 221 | 113 | 108 |
| 25-29 | 135 | 98 | 37 |
| 30-34 | 101 | 70 | 31 |
| 35-39 | 97 | 72 | 25 |
| 40-49 | 129 | 93 | 36 |
| 50-64 | 63 | 49 | 14 |
| Over 65 | 2 | 2 | 0 |
| Age | Total | Men | Women |
|---|---|---|---|
| Under 18 | 207 | 133 | 74 |
| 18-19 | 503 | 305 | 198 |
| 20-21 | 479 | 273 | 206 |
| 22-24 | 166 | 85 | 81 |
| 25-29 | 65 | 54 | 11 |
| 30-34 | 59 | 41 | 18 |
| 35-39 | 55 | 40 | 15 |
| 40-49 | 65 | 46 | 19 |
| 50-64 | 28 | 20 | 8 |
| Over 65 | 1 | 1 | 0 |
| Age | Total | Men | Women |
|---|
Online Student Enrollment
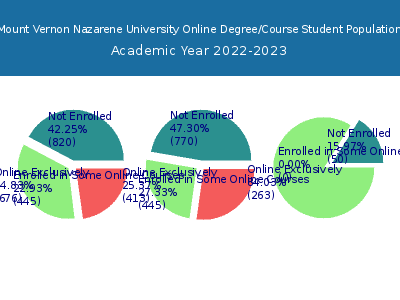
Distance learning, also called online education, is very attractive to students, especially who want to continue education and work in field. At Mount Vernon Nazarene University, 676 students are enrolled exclusively in online courses and 445 students are enrolled in some online courses.
611 students lived in Ohio or jurisdiction in which the school is located are enrolled exclusively in online courses and 65 students live in other State or outside of the United States.
| All Students | Enrolled Exclusively Online Courses | Enrolled in Some Online Courses | |
|---|---|---|---|
| All Students | 1,941 | 676 | 445 |
| Undergraduate | 1,628 | 413 | 445 |
| Graduate | 313 | 263 | 0 |
| Ohio Residents | Other States in U.S. | Outside of U.S. | |
|---|---|---|---|
| All Students | 611 | 65 | 0 |
| Undergraduate | 379 | 34 | 0 |
| Graduate | 232 | 31 | 0 |
Transfer-in Students (Undergraduate)
Among 1,628 enrolled in undergraduate programs, 105 students have transferred-in from other institutions. The percentage of transfer-in students is 6.45%.35 students have transferred in as full-time status and 70 students transferred in as part-time status.
| Number of Students | |
|---|---|
| Regular Full-time | 1,266 |
| Transfer-in Full-time | 35 |
| Regular Part-time | 257 |
| Transfer-in Part-time | 70 |
