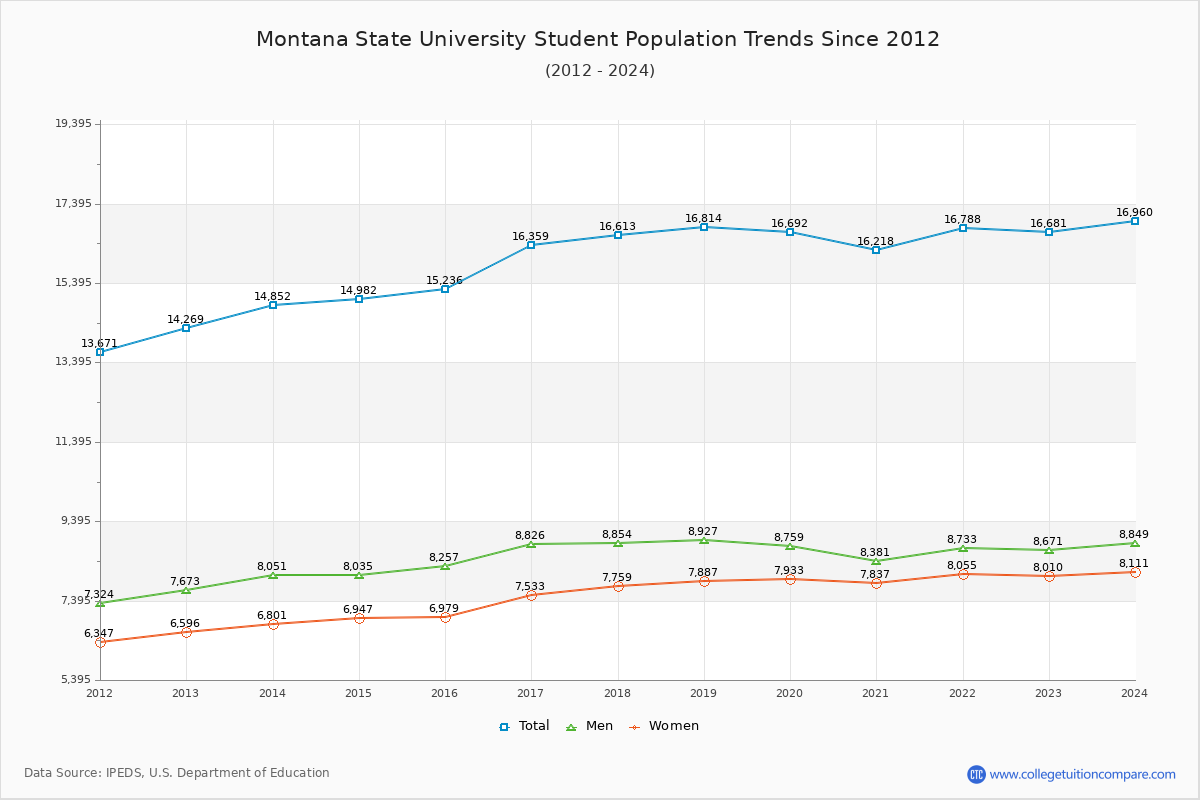
Student Population Changes
The average student population over the last 12 years is 15,955 where 16,681 students are attending the school for the academic year 2022-2023.
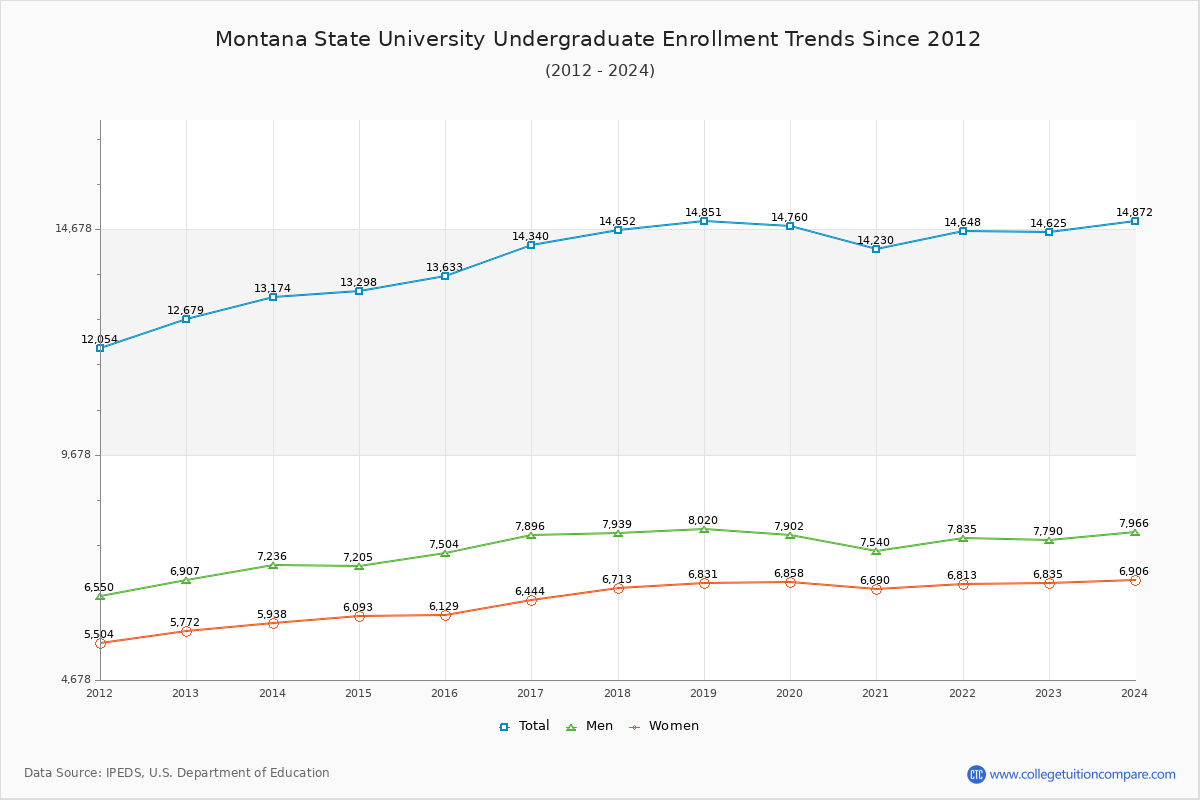
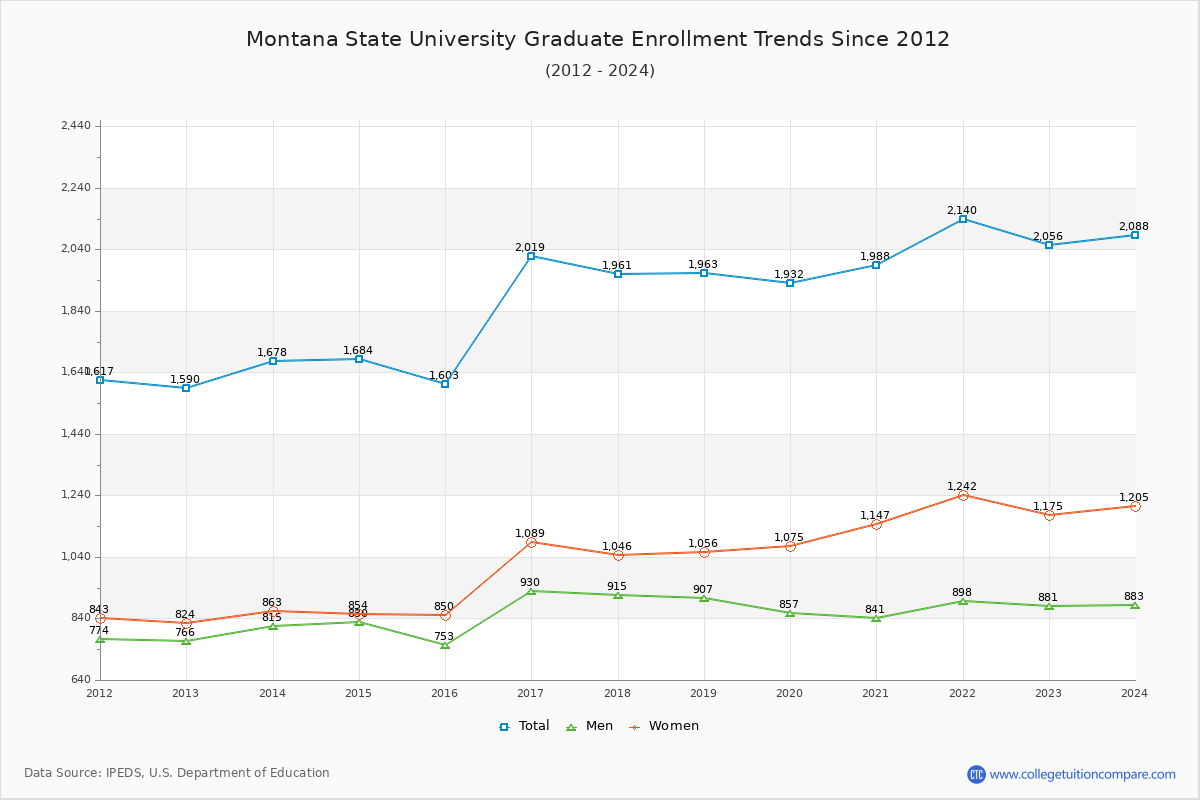
87.67% of total students is undergraduate students and 12.33% students is graduate students. The number of undergraduate students has increased by 1,946 and the graduate enrollment has increased by 466 over past 10 years.
The female to male ratio is 0.92 to 1 and it means that there are similar numbers of female and male students enrolled in MSU.
The following table and chart illustrate the changes in student population by gender at Montana State University since 2012.
| Year | Total | Undergraduate | Graduate | ||||
|---|---|---|---|---|---|---|---|
| Total | Men | Women | Total | Men | Women | ||
| 2012-13 | 14,269 | 12,679 | 6,907 | 5,772 | 1,590 | 766 | 824 |
| 2013-14 | 14,852 583 | 13,174 495 | 7,236 329 | 5,938 166 | 1,678 88 | 815 49 | 863 39 |
| 2014-15 | 14,982 130 | 13,298 124 | 7,205 -31 | 6,093 155 | 1,684 6 | 830 15 | 854 -9 |
| 2015-16 | 15,236 254 | 13,633 335 | 7,504 299 | 6,129 36 | 1,603 -81 | 753 -77 | 850 -4 |
| 2016-17 | 16,359 1,123 | 14,340 707 | 7,896 392 | 6,444 315 | 2,019 416 | 930 177 | 1,089 239 |
| 2017-18 | 16,613 254 | 14,652 312 | 7,939 43 | 6,713 269 | 1,961 -58 | 915 -15 | 1,046 -43 |
| 2018-19 | 16,814 201 | 14,851 199 | 8,020 81 | 6,831 118 | 1,963 2 | 907 -8 | 1,056 10 |
| 2019-20 | 16,692 -122 | 14,760 -91 | 7,902 -118 | 6,858 27 | 1,932 -31 | 857 -50 | 1,075 19 |
| 2020-21 | 16,218 -474 | 14,230 -530 | 7,540 -362 | 6,690 -168 | 1,988 56 | 841 -16 | 1,147 72 |
| 2021-22 | 16,788 570 | 14,648 418 | 7,835 295 | 6,813 123 | 2,140 152 | 898 57 | 1,242 95 |
| 2022-23 | 16,681 -107 | 14,625 -23 | 7,790 -45 | 6,835 22 | 2,056 -84 | 881 -17 | 1,175 -67 |
| Average | 15,955 | 14,081 | 7,616 | 6,465 | 1,874 | 854 | 1,020 |