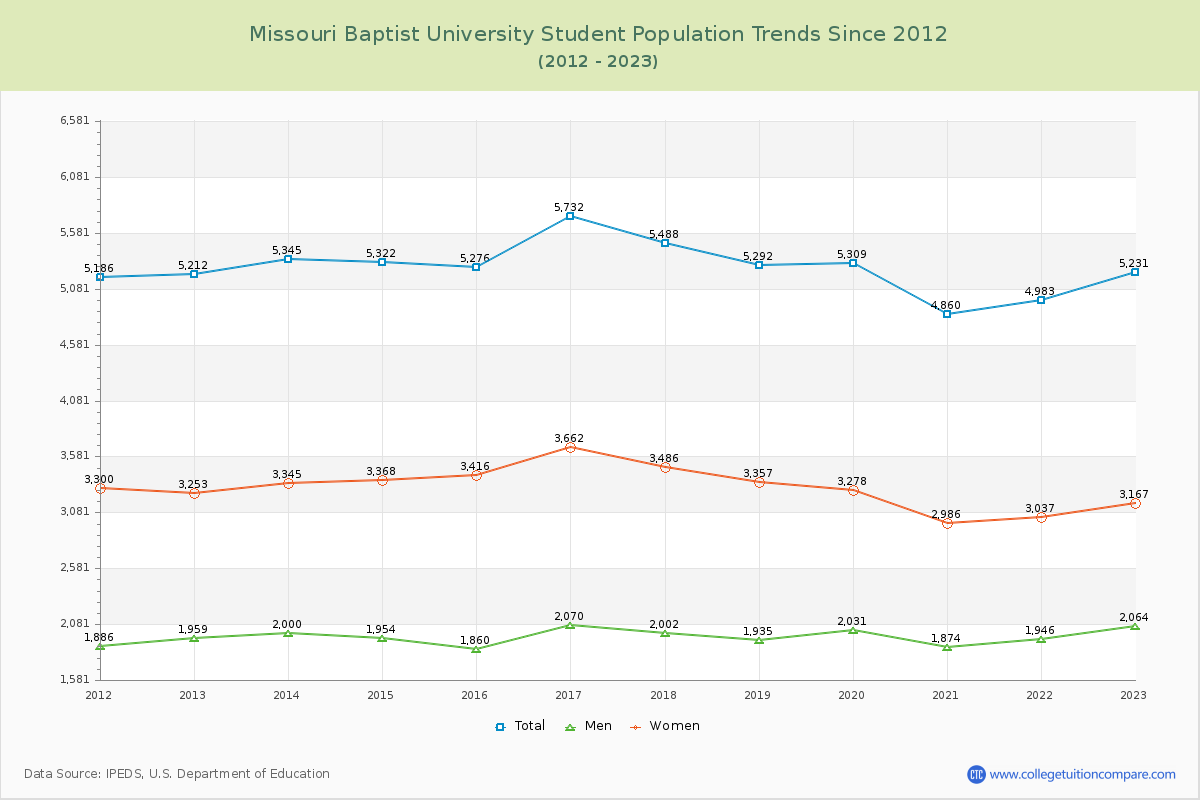
Student Population Changes
The average student population over the last 12 years is 5,277 where 5,231 students are attending the school for the academic year 2022-2023.
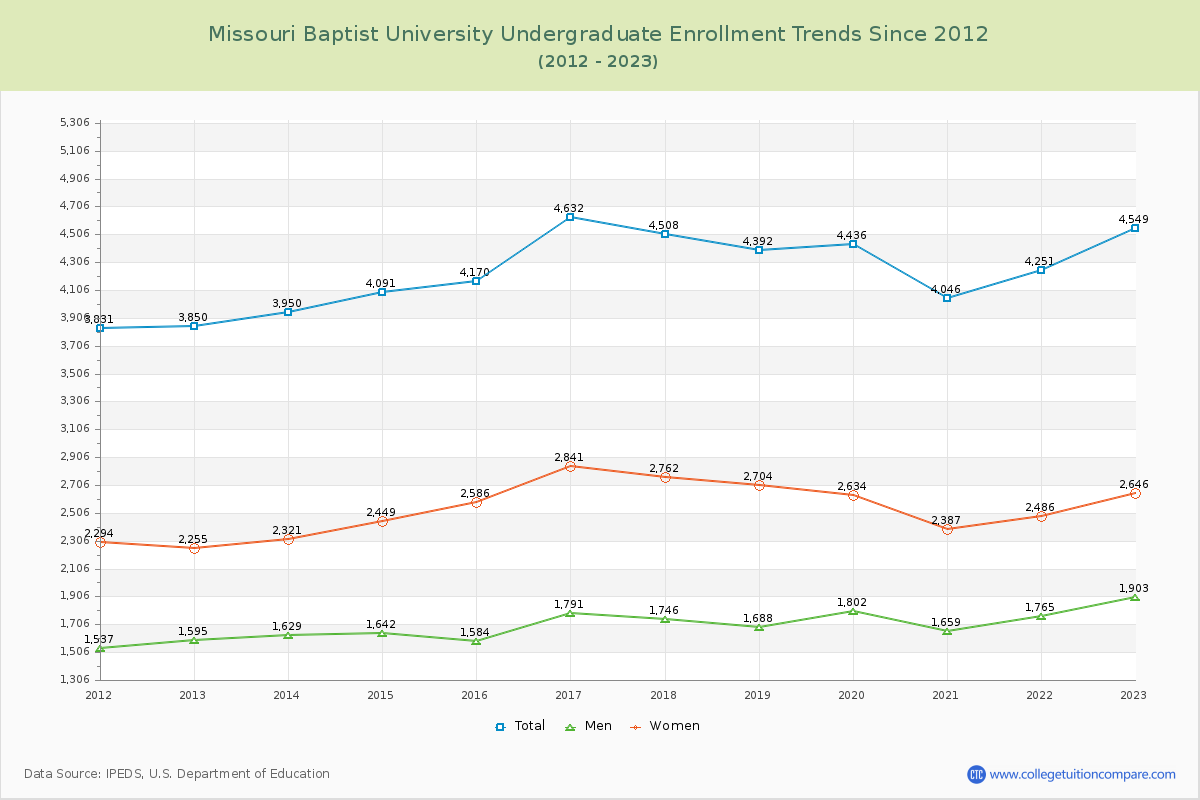
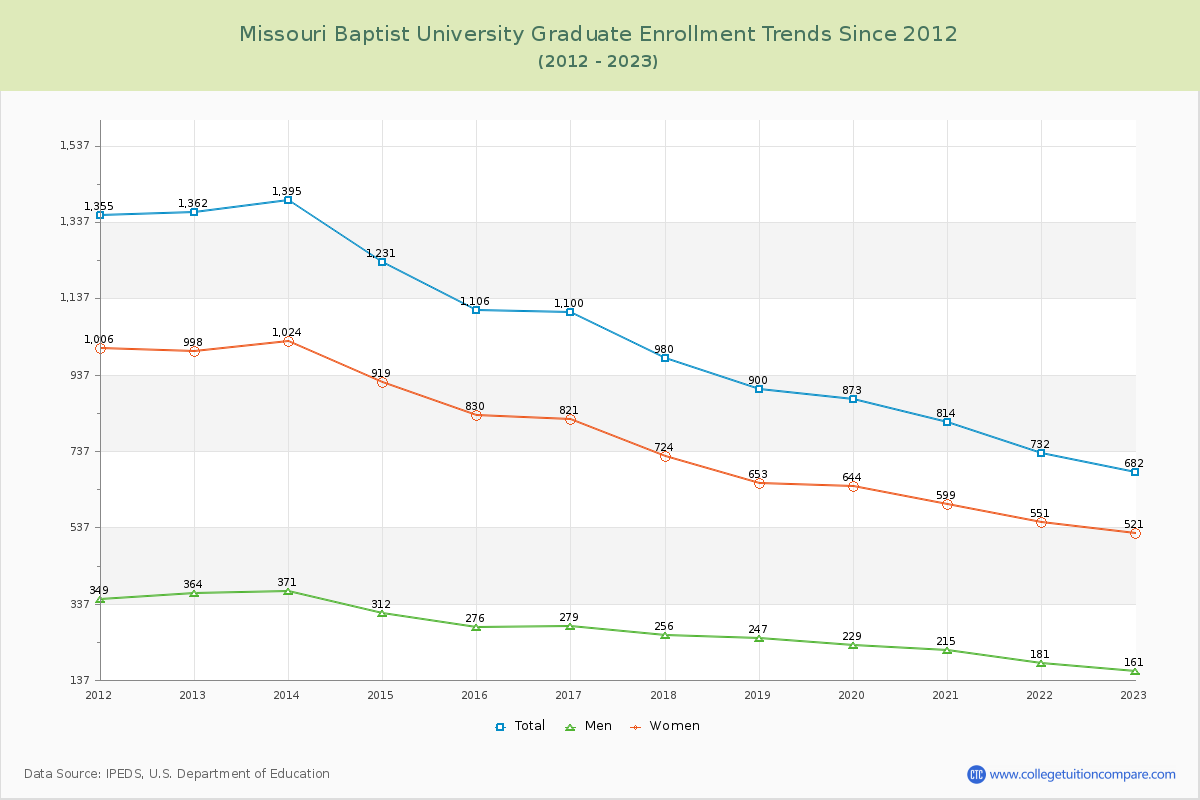
86.96% of total students is undergraduate students and 13.04% students is graduate students. The number of undergraduate students has increased by 699 and the graduate enrollment has decreased by 680 over past 10 years.
The female to male ratio is 1.53 to 1 and it means that there are more female students enrolled in MBU than male students.
The following table and chart illustrate the changes in student population by gender at Missouri Baptist University since 2012.
| Year | Total | Undergraduate | Graduate | ||||
|---|---|---|---|---|---|---|---|
| Total | Men | Women | Total | Men | Women | ||
| 2012-13 | 5,212 | 3,850 | 1,595 | 2,255 | 1,362 | 364 | 998 |
| 2013-14 | 5,345 133 | 3,950 100 | 1,629 34 | 2,321 66 | 1,395 33 | 371 7 | 1,024 26 |
| 2014-15 | 5,322 -23 | 4,091 141 | 1,642 13 | 2,449 128 | 1,231 -164 | 312 -59 | 919 -105 |
| 2015-16 | 5,276 -46 | 4,170 79 | 1,584 -58 | 2,586 137 | 1,106 -125 | 276 -36 | 830 -89 |
| 2016-17 | 5,732 456 | 4,632 462 | 1,791 207 | 2,841 255 | 1,100 -6 | 279 3 | 821 -9 |
| 2017-18 | 5,488 -244 | 4,508 -124 | 1,746 -45 | 2,762 -79 | 980 -120 | 256 -23 | 724 -97 |
| 2018-19 | 5,292 -196 | 4,392 -116 | 1,688 -58 | 2,704 -58 | 900 -80 | 247 -9 | 653 -71 |
| 2019-20 | 5,309 17 | 4,436 44 | 1,802 114 | 2,634 -70 | 873 -27 | 229 -18 | 644 -9 |
| 2020-21 | 4,860 -449 | 4,046 -390 | 1,659 -143 | 2,387 -247 | 814 -59 | 215 -14 | 599 -45 |
| 2021-22 | 4,983 123 | 4,251 205 | 1,765 106 | 2,486 99 | 732 -82 | 181 -34 | 551 -48 |
| 2022-23 | 5,231 248 | 4,549 298 | 1,903 138 | 2,646 160 | 682 -50 | 161 -20 | 521 -30 |
| Average | 5,277 | 4,261 | 1,709 | 2,552 | 1,016 | 263 | 753 |